Do growth and value investing styles have momentum? If so, can investors/traders enhance momentum trading returns by accounting for the stylishness of stocks (the degree to which they fit into either a growth or value style)? In their August 2008 paper entitled “Style Investing, Co-movement and Return Predictability”, Sunil Wahal and Deniz Yavuz measure returns from the combination of stock momentum and stock stylishness. They consider momentum portfolio formation and holding intervals of three, six and 12 months, with an intervening skipped month. They define stock stylishness (but do not use that term) as the degree of stock price co-movement with either growth stocks or value stocks over the past three months. Using monthly returns, book-to-market ratios and market capitalizations for a broad set of stocks over the period 1965-2006, they conclude that:
- High-stylishness, past winner (loser) portfolios consistently and significantly outperform low-stylishness, past winner (loser) portfolios using both raw returns and risk-adjusted (market, size, book-to-market) returns.
- For six-month momentum portfolio formation and holding intervals over the 1999-2006 subperiod, the average raw (risk-adjusted) return increases from 0.86% (1.08%) per month for the least stylish third of stocks to 1.28% (1.50%) percent for the most stylish.
- Long-horizon (more than a year) reversals are also larger for high-stylishness portfolios.
- Results generally hold for: equal-weighted and value-weighted portfolios; raw and risk-adjusted returns; and, major subperiods.
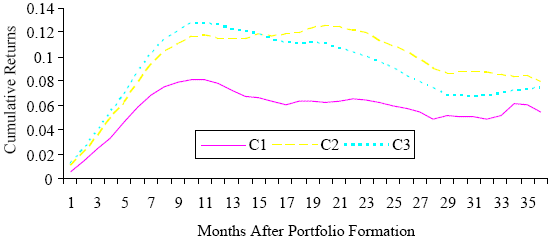
The following chart, taken from the paper, compares average cumulative returns for different levels of stylishness over the 36 months after formation of equal-weighted hedge portfolios based on past six-month momentum (top 10% minus bottom 10%) during 1965-2006. Portfolio C1/C2/C3 contains stocks in the bottom/middle/top third of stylishness, as indicated by the degree to which stock price moves with either growth stocks or value stocks over the prior three months. The chart shows that stylishness substantially augments momentum returns during the first year after portfolio formation. Also, return reversal during the second year after portfolio formation is larger for high-stylishness stocks.

In summary, investors/traders may be able to enhance momentum trading strategies by focusing on stocks that fit most strongly into a growth or value style.