What is the best way to combine styles (smart betas) in one portfolio? In their June 2016 paper entitled “Long-Only Style Investing: Don’t Just Mix, Integrate”, Shaun Fitzgibbons, Jacques Friedman, Lukasz Pomorski and Laura Serban compare two approaches to long-only combined equity style investing:
- Mixed portfolio – simply picks stocks from single-style portfolios.
- Integrated portfolio – first combines single-style rankings into an overall score for each stock and then builds a portfolio based on top overall scores.
They focus on combining momentum stocks (highest return from 12 months ago to one month ago) and value stocks (high book-to-market ratio). They first employ simulated data to illustrate differences in stock selection between the two approaches. They then compare net performances for equally weighted, monthly rebalanced mixed and integrated combinations of liquid global stocks. Using monthly data for large-capitalization stocks from developed markets (roughly the MSCI World Index components) during February 1993 through December 2015, they find that:
- The mixed portfolio may hold stocks with low (even negative) expected returns because of style disagreement, while the integrated portfolio may hold stocks that qualify for neither momentum nor value standalone portfolios (see the simulated plot below).
- Relative to the value-weighted MSCI World Index:
- The standalone value and momentum portfolios outperform by an average annualized net 1.7% and 3.4%, respectively, with tracking errors just under 8%.
- The mixed and integrated combinations of the two styles outperform by an average annualized net 2.5% and 3.6%, respectively, with tracking errors about 4%.
- By netting duplicate standalone positions, the integrated portfolio has about 5%-10% lower annual turnover than the mixed portfolio, thereby lowering reformation frictions.
- The advantages of the integrated portfolio over the mixed portfolio increase with: (1) the number of styles to be combined (especially uncorrelated styles); and, (2) the level of active risk (targeted benchmark tracking error).
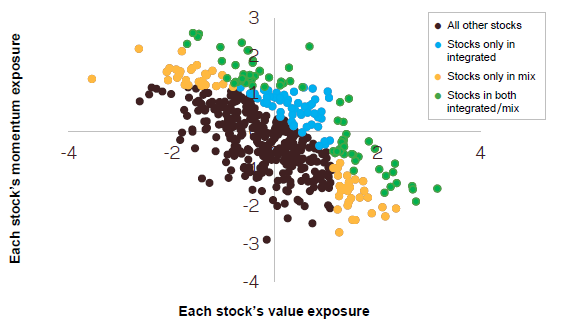
The following scatter plot, taken from the paper, illustrates interactions of the two approaches to combining momentum and value exposures with 500 simulated stocks. Each portfolio holds 25% of the universe.
- Blue circles denote stocks unique to the integrated portfolio. Such stocks are not very attractive based on either momentum or value, but neither are they unattractive.
- Yellow circles denote stocks unique to the mixed portfolio. While attractive based on one style, they may be unattractive based on the other.
- Green circles denote stocks held in both mixed and integrated portfolios. These stocks are most desirable, closest to the upper right quadrant of momentum and value exposures.
In performance tests with actual stocks, the equally weighted and monthly rebalanced yellow, blue and green portfolios generate annualized alphas versus the MSCI World Index of 1.4%, 3.2% and 4.2%, respectively.
In summary, evidence indicates that combining equity investing styles via an integrated ranking system outperforms simple mixing of stocks from single-style portfolios.
Cautions regarding findings include:
- Analyses focus on the selection of like assets (stocks) for which style comparisons are straightforward. Integrating styles across asset classes may be problematic.
- As noted in the paper, net results account for monthly portfolio reformation frictions but not any fees associated with portfolio (fund) access.