Is there a most practical way to make value and momentum work together across stocks? In the April 2016 version of their paper entitled “Combining Value and Momentum”, Gregg Fisher, Ronnie Shah and Sheridan Titman examine long-only stock portfolios that seek exposure to both value and momentum while suppressing trading frictions. They define value as high book-to-market ratio based on book value lagged at least four months. They define momentum as return from 12 months ago to one month ago. They consider two strategies for integrating value and momentum:
- Each month, choose stocks with the highest simple average value and momentum percentile ranks. They suppress turnover with buy-sell ranges, either 90-70 or 95-65. For example, the 90-70 range adds stocks with ranks higher than 90 not already in the portfolio and sells stocks in the portfolio with ranks less than 70.
- After initially forming a value portfolio, each month buy stocks only when both value and momentum are favorable, and sell stocks only when both are unfavorable. This strategy weights value more than momentum, because momentum signals change more quickly than value signals. For this strategy, they each month calculate value and momentum scores for each stock as percentages of aggregate market capitalizations of other stocks with lower or equal value and momentum. They suppress turnover with a 90-70 or 95-65 buy-sell range, but the range applies only to the value score. There is a separate 50 threshold for momentum score, meaning that stocks bought (sold) must have momentum score above (below) 50.
They consider large-capitalization stocks (top 1000) and small-capitalization stocks (the rest) separately, with all portfolios value-weighted. They calculate turnover as the total amount bought or sold each month relative to portfolio size. They consider two levels of round-trip trading frictions based on historical bid-ask spreads and broker fees: high levels (based on 1993-1999 data) are 2.94% for small stocks and 1.06% for large stocks; low levels (based on 2000-2013 data) are 0.82% for small stocks and 0.41% large stocks. They focus on net Sharpe ratio as a performance metric. Using monthly data for a broad sample of U.S. common stocks during January 1974 through December 2013, they find that:
- Pure small and large value portfolios (with turnover suppressed via score ranges) outperform the overall market on a net basis for both high and low levels of trading frictions. However, outperformance among large stocks is marginal.
- Pure momentum portfolios (with turnover suppressed via score ranges) marginally outperform the overall market on a net basis for large stocks, but mostly underperform for small stocks.
- 50-50 pure value and pure momentum portfolios, rebalanced monthly (with turnover suppressed via score ranges):
- Modestly beat the separate value and momentum portfolios based on net Sharpe ratio for large stocks.
- Beat the momentum portfolios, but not the value portfolios, for small stocks.
- Both of the value-momentum integration strategies specified above beat the simple 50-50 combined pure portfolios (and a simple 70-30 pure value-momentum combination) based on net Sharpe ratio (see the charts below).
- The second integration strategy exhibits low momentum exposure compared to other approaches considered, and therefore has lower turnover. The second strategy is preferable to the first when:
- Trading frictions are high.
- The value premium is high compared to the momentum premium.
- Value and momentum signals are highly correlated.
- Higher buy and sell thresholds usually generate higher average returns and higher turnover. Wider buy-sell ranges usually generate slightly lower average returns and lower turnover.
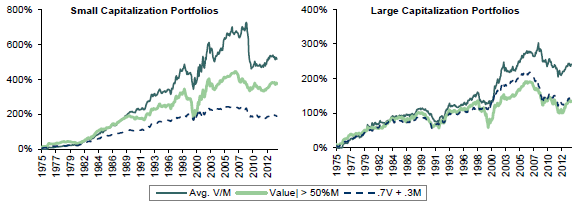
The following charts, taken from the paper, compare net cumulative performances of three strategies for small-capitalization and large-capitalization stock universes with low levels of trading frictions and 90-70 turnover suppression thresholds as specified above:
- Avg. V/M: the first value-momentum integration strategy described above.
- Value| > 50%M: the second value-momentum integration strategy described above.
- .7V + .3M: a simple combination of 70% pure value portfolio and 30% pure momentum portfolio, rebalanced monthly.
Results show that the integration approaches generally beat the pure combination, but bear some large drawdowns.
In summary, evidence indicates that investors may be able to combine value and momentum strategies for U.S. stocks more efficiently than holding separate portfolios of each.
Cautions regarding findings include:
- The two value-momentum integration strategies are elaborate, with room for snooping ranking/scoring schemes and stock value/momentum buy-sell thresholds and ranges. Specifically:
- Testing multiple strategies/strategy variations on the same data introduce explicit snooping bias, such that the best-performing strategy overstates expectations.
- There may be additional snooping bias from rejected strategy variations explored during development but not disclosed in the paper.
- Estimated trading frictions are based on measurements from 1993-1999 and 2000-2013 but applied also to trading during the 1975-1992.
- Monthly portfolio selection and implementation for the value-momentum integration strategies are beyond the capabilities of most investors, who would bear fees for delegating the processes to a fund manager/advisor, thereby reducing net performance.
- As noted above, the value-momentum integration strategies suffer some large drawdowns.