Do stocks that are difficult to trade (have low liquidity) offer abnormal returns as compensation for the risk of getting out of them? Or, is this reward-for-risk intuition unsound? In their recent paper entitled “Cross-Sectional Stock Returns in the UK Market: the Role of Liquidity Risk”, Soosung Hwang and Chensheng Lu investigate the relationship between liquidity and return for individual stocks, with focus on the link between liquidity and the value premium. They introduce a new measure of liquidity based on the absolute change in stock price per unit of turnover, with turnover calculated as the fraction of firm market capitalization traded. Using price, trading volume, capitalization and fundamentals data for UK stocks over the period 1987-2004, they conclude that:
- In contrast with U.S. data, the size effect for UK stocks is negative. The tenth of stocks with the largest capitalizations outperforms the tenth with the smallest by a statistically insignificant 5.7% annually.
- There is strong evidence of a value premium for UK stocks. The tenth with the lowest book-to-market ratios outperform the tenth with the highest by over 10% annually. Small stocks tend to fall in the high book-to-market category.
- The tenth of stocks that are most liquid outperform the least liquid tenth by an impressive 18% annually.
- The premium of liquid over illiquid stocks is robust to adjustments based on size, value and momentum factors, and to a number of macroeconomic variables. Moreover, this liquidity effect may substantially explain the value premium.
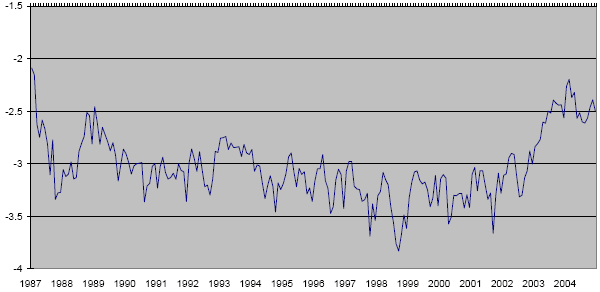
- Stock market crashes correspond to minimums of overall market liquidity, calculated as an average of the liquidities of individual stocks. (See chart below.)
The following chart, taken from the paper, shows monthly overall market liquidity (average of the liquidities of individual stocks) in the UK during 1987 to 2004. The most illiquid points occur in 1997 (Asian financial crisis), 1998 (LTCM collapse and Russian default) and 2001 (September 11th). By contrast, liquidity during the first two years of the recent bull market is very high.

In summary, the most liquid stocks on average outperform, and this liquidity effect may be central to the value premium.
The results of this study seem in conflict with those of others. The relationships between factors and stock returns sometimes seem to depend on when, where and how the testing is done.