Is there some stock value metric that is markedly superior to the conventional book-to-market ratio (BM) for identifying undervalued and overvalued stocks? In his July 2016 paper entitled “Value Investing with Dividend-to-Market Ratio”, Yiqing Dai tests the effectiveness of maximum payable dividend ratio (DM) ) as an alternative to book-to-market ratio for value investing. He specifies DM as (profitability – investment)/market value, the difference between earning power of firm assets and reinvestment required to generate future earnings. He specifies profitability as prior-year revenue minus prior-year cost of goods sold, selling, general and administrative expenses, research and development expenditures and interest expense. He specifies investment as prior-year book equity times change in total assets from two years ago to prior-year, divided by change in assets. Using the specified accounting data and monthly returns for a broad sample of non-financial U.S. stocks during July 1963 through December 2013, he finds that:
- Portfolios formed by double sorts on BM and DM indicate that BM is imprecise compared to DM for value investing.
- The 30% of high-BM stocks with low DM values (low prices with low intrinsic values) underperform the market by an average 0.10% per month.
- The 7.6% of low-BM stocks with high DM values (high prices with high intrinsic values) outperform the market by an average 0.19% per month.
- Holding DM fixed, stocks with high BM do not significantly outperform stocks with low BM.
- DM is more effective at picking value stocks than a linear combination of BM, profitability and investment.
- A DM factor generates significant alpha relative to the Fama-French five-factor (market, size,
BM, profitability, investment) model of stock returns. In contrast, a three-factor model including only market, size and DM factors fully explains the BM, profitability and investment factors. - None of earnings-to-price ratio, cash flow-to-price ratio, gross profitability, operating profitability or return-on-equity factors exhibits statistically reliable alpha after controlling for DM. In contrast, the DM factor consistently produces a large, highly significant alpha after controlling for these other profitability factors.
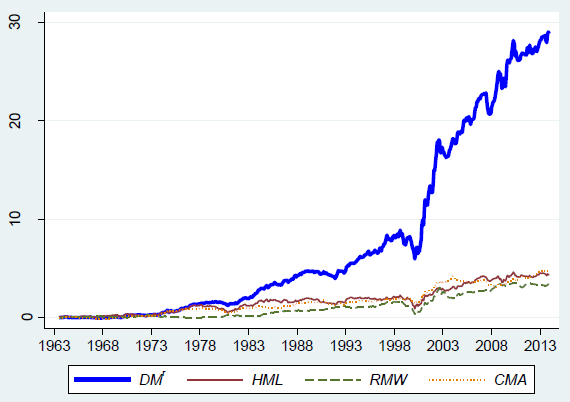
- An equally weighted, long-short portfolio reformed annually from 2×3 double sorts with size grows an initial $1 DM factor exposure to a gross $28.84 over the entire sample period, compared to only $4.35, $3.30 and $4.72 for comparable BM, profitability and investment factor exposures, respectively (see the chart below). The corresponding annualized gross Sharpe ratio is 0.81 for the DM factor, compared to 0.39, 0.36 and 0.48 for the BM, profitability and investment factors.
- Results are similar for two subperiods before and after July 1988, though the DM factor gross annualized Sharpe ratio declines (from 0.94 to 0.73).
- Trailing 10-year gross annualized Sharpe ratios for DM are fairly stable, with only two notable dips in the early 1970s and the late 1990s.
- Results hold for the largest stocks comprising the top 90% of market capitalization, but are stronger for small stocks (gross annualized DM factor Sharpe ratio 0.50 versus 1.10).
The following chart, taken from the paper, compares cumulative values of $1 initial investments in each of equally weighted, annually reformed DM, BM (HML), profitability (RMW) and investment (CMA) factor portfolios constructed using 2×3 sorts with size over the entire sample period. Terminal values are $28.84 for the DM factor portfolio, $4.35 for HML, $3.30 for RMW and $4.72 for CMA.
In summary, evidence indicates that profitability minus investment (DM) is a much stronger predictor of future stock returns than book-to-market ratio (BM), and DM outperforms a linear combination of BM, profitability and investment.
Cautions regarding findings include:
- Reported results are gross, not net. Accounting for portfolio reformation frictions and shorting costs would reduce performance of all portfolios. Moreover:
- Reformation frictions vary considerably over the sample period, affecting subperiod analyses.
- Shorting may not be feasible for some stocks as assumed for long-short factor portfolios.
- Factor portfolio turnovers may differ, such that a net performance comparison may differ from a gross performance comparison.
- Testing the predictive powers of many factors/combinations of factors on the same set of data introduces snooping bias, such that the best-performing factors/combinations overstate predictive powers. This bias extends to prior studies and unreported experimentation.