Is there a simple way to identify and exploit relative differences in the values of emerging equity markets? In their September 2010 paper entitled “New Evidence on Value Investing in Emerging Equity Markets”, Zhipeng Yan and Yan Zhao define and test value investing strategies that compare a country’s weight among a set of emerging markets based on value (GDP, earning-price ratio or dividend yield) to its weight based on stock market capitalization. Specifically, they construct and rebalance quarterly a portfolio of emerging markets stock indexes with weights equal to value-capitalization weight deltas. They consider also a simple alternative portfolio similarly constructed from equal-capitalization weight deltas. If the delta for a country is positive (negative), the position in that country’s index is long (short), such that the overall portfolio is neutral. Using quarterly GDP measurements, monthly earnings-to-price ratio and dividend yield data and monthly dollar-denominated total stock index returns for 23 emerging markets spanning 1995-2008, they find that:
- Strategies using the differences between GDP, earnings-price ratio, dividend yield or equal weights and market capitalization weights generate gross annualized returns of 14.3%, 16.9%, 14.4% and 14.3%, respectively, over the entire sample period. Accounting for 0.5% one-way trading frictions, net returns are 13.1%, 14.8%, 13.0%, and 13.7%, respectively.
- Net Sharpe ratios for these delta-weight portfolios range from 0.58 to 0.65, compared to 0.12 for the MSCI Emerging Markets Index and 0.15 for the S&P 500 Index.
- Practical constraints that limit each country index portfolio weight to ten, five or three times its weight in the world portfolio reduce, but do not eliminate, net outperformance of the delta-weight portfolios.
- The delta-weight strategies may not work well with developed countries, for which value metrics tend to track market capitalization closely.
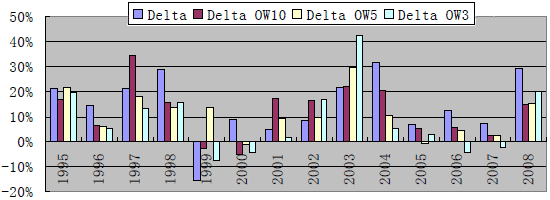
The following chart, taken from the paper, shows the quarterly returns for four emerging markets delta-weight portfolios based on the earnings-price ratio (earnings yield) value metric over the entire 1995-2008 sample period. The Delta portfolio is the basic delta-weight strategy described above. The Delta OW10, Delta OW5 and Delta OW3 portfolios constrain overweighting of country indexes to ten, five and three times their weights in the world portfolio (at the time of quarterly rebalancing). The basic strategy is profitable in 13 of 14 years. In most years, overweighting constraints reduce profitability.
The basic GDP, dividend yield and equal delta-weight strategies are profitable in 11 of 14, 12 of 14 and 12 of 14 years, respectively (see the paper).

In summary, evidence indicates that investors may be able to outperform a benchmark emerging markets index by exploiting simple country-level value metrics.