What indicator works best to mitigate stock momentum strategy crashes? In his March 2015 paper entitled “Momentum Crash Management”, Mahdi Heidari compares performances of seven indicators for avoiding conventional stock momentum strategy crashes: (1) prior-month market return; (2) change in prior-month market return: (3) market volatility (standard deviation of 52 weekly returns); (4) dispersion (variance) of daily returns across all stocks; (5) market illiquidity (aggregate impact of trading on price); (6) momentum volatility (standard deviation of momentum strategy returns the past six months); and, (7) change in momentum volatility. The conventional strategy is each month long (short) the value-weighted tenth of stocks with the highest (lowest) returns from 12 months ago to one month ago. For each of the competing indicators, he invests in the conventional momentum strategy (cash) when the indicator is below (within) the top 10% of its values over the past five years. He uses portfolio turnover to compare implementation costs. Using data for a broad sample of relatively liquid U.S. stocks during January 1926 through December 2013, he finds that:
- Over the entire sample period, the conventional momentum strategy has:
- Gross average monthly return 1.38%.
- Gross three-factor (market, size, book-to-market) alpha 1.88%.
- Gross annualized Sharpe ratio 0.59.
- Very negative return skewness, with the most extreme crashes in 1932 (losing 92% in two months) and 2009 (losing 73% in three months).
- Regarding the seven potentially crash-avoiding indicators:
- All relate negatively to next-month momentum return, both overall and during crashes.
- Almost all of the predictive power across indicators comes from crash periods.
- Most of the predictive power comes from loser (short) side of portfolios.
- Change in momentum volatility has the highest predictive power, explaining about 12% of the variation in next-month momentum returns over the entire sample.
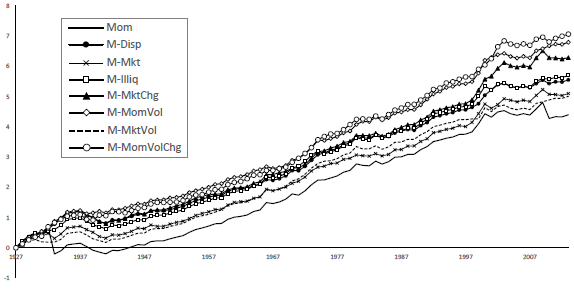
- Using the binary signal test strategy, all seven indicators boost the Sharpe ratio and dampen/eliminate the negative return skewness of the conventional strategy (see the chart below). Enhanced gross annualized Sharpe ratios range from 0.68 for prior-month market return to 1.10 for change in momentum volatility.
- Turnovers of the enhanced momentum strategies are similar to that of the conventional strategy (84% to 104%). suggesting similar implementation costs.
- Combining any of the enhanced momentum strategies with a value strategy based on long (short) positions in the tenth of stocks with the highest (lowest) book-to-value ratios boosts Sharpe ratio slightly.
The following chart, taken from the paper, compares the log gross cumulative values of equal initial investments in the conventional stock momentum strategy (Mom) and the seven binary-signal risk mitigation strategies specified above.
All seven variations improve performance. Change in momentum volatility (M-MomVolChg) produces the highest terminal value and the highest Sharpe ratio.
In summary, evidence from a strategy horse race indicates that monthly change in momentum strategy return volatility is the best (binary signal) crash protection indicator for a conventional stock momentum strategy.
Cautions regarding findings include:
- The study does not address data snooping bias from trying many indicators on the same data, so the best-performing indicator overstates expectations. There may be additional hidden snooping bias from unpublished experimentation with other indicators.
- While offering some subperiod testing, the study does not test robustness of the five-year look-back interval used to determine binary signals.
- Results do not explicitly quantify trading frictions from monthly portfolio reformation or costs of shorting. These costs would reduce performances of all strategies. Shorting may not be feasible for some stocks.