Are trend following (intrinsic or time series momentum) and risk parity complementary multi-class portfolio construction approaches? In his October 2015 paper entitled “Trend-Following, Risk-Parity and the Influence of Correlations”, Nick Baltas compares performances of inverse volatility weighting and risk parity weighting as adapted to a long-short trend following strategy. Unlike volatility weighting, risk parity weighting incorporates asset return correlations, assigning higher (lower) weights to assets with lower (higher) average pairwise correlations with other assets. For both weighting schemes, portfolios are each month long (short) assets with positive (negative) past 12-month returns. Monthly inverse volatility weights derive from actual daily asset return volatilities over the past 90 trading days. Monthly risk parity weights derive from actual daily asset return volatilities and correlations over the past 90 trading days. Both weighting schemes target 10% portfolio volatility by each month applying overall leverage based on actual annualized volatility of an unleveraged trend following portfolio over the past 60 trading days divided by 10%. Using daily closing prices for the most liquid contract for each of 35 (6 energy, 10 commodity, 6 government bond, 6 currency exchange rate and 7 equity index) futures contract series as available during January 1987 through December 2013, he finds that:
- Long-short trend following with inverse volatility weighting works well over the entire sample period, but breaks down in recent years:
- Over the entire sample period, this combination strategy generates a gross annual Sharpe ratio of 1.31, compared to 0.70 for long-only inverse volatility weighting.
- However, during 2009 through 2013, gross annual Sharpe ratio is only 0.31, compared to 0.59 of the long-only inverse volatility weighting.
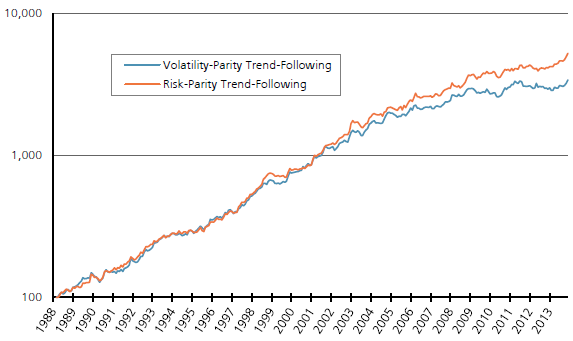
- Using risk parity weighting instead of inverse volatility weighting further enhances the performance of trend following (see the chart below):
- Over the entire sample period, trend following plus risk parity weighting generates a gross annual Sharpe ratio of 1.48.
- During 2009 through 2013, it has a gross annual Sharpe ratio of 0.78.
- Moreover, risk parity weighting manages downside risk better than inverse volatility weighting, with higher Sortino ratio (arithmetic mean return over annualized downside volatility) and Calmar ratio (geometric mean return over maximum drawdown).
- The superiority of risk parity weighting over inverse volatility weighting derives mostly from times when average pairwise asset return correlation is high.
- However, in combination with trend following, risk parity weighting produces bigger swings in weights than inverse volatility weighting:
- For example, allocation to fixed income ranges from 10% to 76% (18% to 48%) for risk parity (inverse volatility) weighting.
- Risk parity weighting thus generates higher portfolio turnover (and higher frictions) than inverse volatility weighting (average monthly two-way turnover 58% versus 32%).
- Regardless of weighting scheme, trend following performance tends to deteriorate as average pairwise asset return correlation rises.
The following chart, taken from the paper, compares gross cumulative performances of long-short trend following combined with inverse volatility weighting (Volatility-Parity) and risk parity weighting (Risk-Parity) as described above. Until 2003 (low correlation regime), the two weighting schemes perform similarly. Subsequently, when average asset pairwise correlation increases, risk parity weighting tilts toward (away from) assets that are less (more) correlated with other assets and is therefore better diversified than inverse volatility weighting.

In summary, evidence indicates that trend following combined with risk parity weighting works better than trend following combined with inverse volatility weighting for a multi-class portfolio, due mainly to better performance when asset class return correlations are elevated.
Cautions regarding findings include:
- Performance calculations are gross, not net. Accounting for monthly portfolio reformation frictions would reduce returns, somewhat more so for risk parity weighting than inverse volatility weighting.
- Any costs of leverage (> 1X) and margin calls would also reduce returns.
- There may be data snooping bias in selection of the trend following calculation interval (12 months), the volatility/risk calculation interval (90 trading days) and the volatility target leverage calculation parameters (10% and 60 trading days). Any such bias would result in overstated expected performance.
- Risk parity weighting calculations are complex, such that most investors would have to delegate them and pay an associated management fee.
- As noted in the paper, there are long subperiods when risk parity weighting does not outperform the simpler inverse volatility weighting (and may underperform on a net basis).