
Does the tendency of stock market volatility measures to persist offer an exploitable short-term reversion to mean? In other words, can traders win on average by speculating that market volatility spikes will soon reverse? To check, we first test for short-term reversion of the implied volatility of the S&P 500 Index (VIX) over its available history. We then test for exploitability of any discovered reversion via the investable iPath S&P 500 VIX Short-Term Futures ETN (VXX), which seeks to replicate the return on short-term VIX futures. Using daily closes of VIX for January 1990 through December 2012 (5,794 trading days) and daily adjusted closes of VXX for February 2009 through December 2012 (987 trading days), we find that:
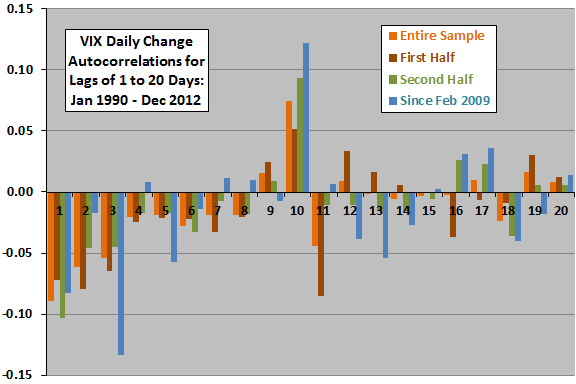
The following chart summarizes correlations between the change in VIX on a given trading day and the change in VIX on each of the next 21 trading days over the entire sample period, two equal subperiods and since February 2009 (inception of VXX). While the correlations are generally small, the cumulative effect of the mostly negative values for days 1 through 8, mostly persistent across subsamples, indicates meaningful reversion.
To investigate the size of this reversion, and the degree to which it is systematic, we look at average future 8-day future changes in VIX by ranges of prior-day change in VIX.
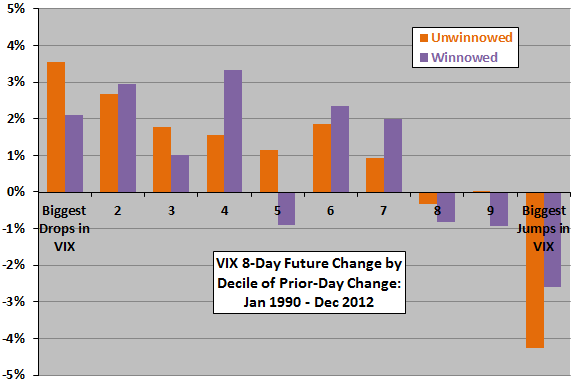
The next chart summarizes average future 8-day changes in VIX by decile of prior-day change in VIX (assuming a trader could estimate daily VIX change just before the close for action at the same close) over the entire sample period in two ways:
The unwinnowed results use all trading days with overlapping 8-day reversion intervals (578-579 observations per decile).
Overlapping measurement intervals can distort statistics. The winnowed results use every eighth trading day to eliminate reversion interval overlap (only 72-73 observations per decile).
Results suggest that a trader may be able to exploit short-term reversion of VIX with some reliability by betting on reversals of extreme daily moves. However, progression of average future returns across deciles is not very systematic for winnowed data.
There is no pattern in the volatility (standard deviation) of 8-day changes in VIX across deciles for either unwinnowed or winnowed results.
Can we use VXX to exploit the empirical VIX reversion?
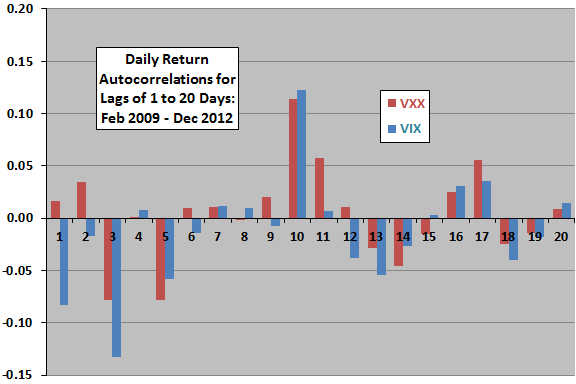
The next chart summarizes correlations between the return for VXX on a given trading day and the return for VXX on each of the next 21 trading days over the life of VXX. For comparison, it shows comparable correlations for VIX. Results indicate that VXX exhibits slight momentum rather than reversion during the first two days.
Do results leave any returns for a short-term reversion trader?
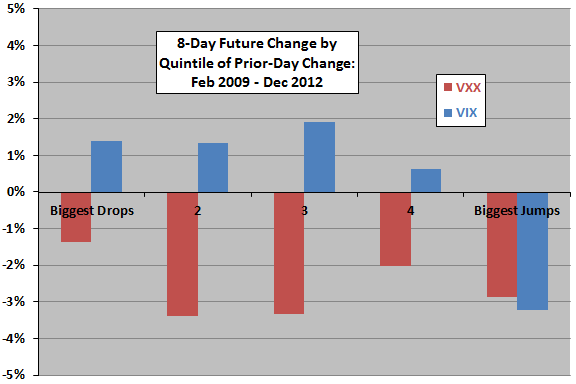
The final chart summarizes average future 8-day gross returns for VXX by quintile of prior-day returns for VXX over the life of VXX (195-196 observations per quintile). It also shows comparable results for changes in VIX. Data are unwinnowed (the sample is too small for winnowing). While reversion of VIX again appears potentially exploitable for extreme quintiles, VXX does not do the job. The gross 8-day reversion returns for all VXX quintiles are negative. Including trading frictions would worsen returns.
Volatilities (standard deviations) of 8-day returns/changes are notably higher for extreme quintiles than middle quintiles for both VXX and VIX, and volatilities of VXX returns are smaller than those for changes in VIX for all quintiles.
Reasons why VXX may not track VIX closely enough to exploit predictable VIX behaviors include:
- Differences between the behaviors of VIX and VIX futures, including the feedback of aggregate VXX trading.
- Trading frictions experienced by the VXX manager in implementing VXX.
- VXX management/administrative fees.
In summary, evidence from simple tests on available data does not support a belief that traders can systematically employ VXX to exploit short-term reversion of VIX.
Other approaches to exploiting short-term VIX reversion, or methods of exploiting other logical consequences of volatility persistence, may work better.
Frequently Asked Questions
What is the VIX and what does VXX track?
The VIX is the implied volatility of the S&P 500 Index, a measure of expected stock market volatility. The iPath S&P 500 VIX Short-Term Futures ETN (VXX) is an investable product that seeks to replicate the return on short-term VIX futures, making it a way to trade volatility exposure.
Can you profit from VIX mean reversion by trading VXX?
Trading VXX did not exploit short-term VIX reversion in the article's tests. Gross 8-day reversion returns were negative for all VXX quintiles from February 2009 through December 2012, and trading frictions would worsen them. The evidence does not support a belief that traders can systematically use VXX this way.
How do you test whether VIX reverts to the mean after big daily moves?
The VIX reversion test correlates each day's VIX change with changes over the next 21 trading days, using daily closes from January 1990 through December 2012 (5,794 days). It then sorts days into deciles by prior-day VIX change and averages the following 8-day changes, using both overlapping and non-overlapping (every eighth day) observations. The same quintile approach was applied to VXX returns over 987 trading days since February 2009.
Why doesn't VXX behave like the VIX index?
VXX does not track VIX closely enough to capture VIX reversion because it follows VIX futures rather than the index itself. VXX showed slight momentum over the first two days instead of reversion, and its 8-day return volatility was smaller than VIX changes for all quintiles. Possible reasons include differences between VIX and VIX futures behavior, trading frictions faced by the VXX manager, and management/administrative fees.
What are the limitations of VIX reversion trading strategies?
The VIX reversion pattern is small and not very systematic: correlations are generally small, and the progression of average future returns across deciles is not very systematic in the winnowed (non-overlapping) data, which has only 72-73 observations per decile. Overlapping measurement intervals can distort statistics, and the VXX sample is too small to winnow. Volatility of 8-day changes is also notably higher for extreme quintiles than for middle ones.