The Chicago Board Options Exchange (CBOE) Volatility Index (VIX) gets special attention from investing experts and the financial media as the “investor fear gauge.” What are the origins of VIX, and why was it created? In his November 2008 draft paper entitled Understanding VIX, VIX creator Robert Whaley describes the purpose, history and essential characteristics of this index. Using historical data from January 1986 through October 2008, he explains that:
- VIX was created to provide a benchmark of expected short-term market volatility and a quantitative basis for volatility futures and options contracts. Most succinctly, VIX reflects the price of stock portfolio insurance.
- VIX is a forward-looking measure of the stock market volatility investors expect to see over the next 30 days, implied from the prices of S&P 500 index options. It is not a backward-looking measure of historical (realized) volatility.
- Empirically, VIX works reasonably well as a predictor of future stock index volatility.
- VIX tends to follow a mean-reverting path.
- Because of the nature of demand for portfolio insurance, VIX and the S&P 500 index vary asymmetrically. VIX is a better barometer of investor fear of downside momentum than of investor greed in a market rally.
- While the October 2008 levels of VIX are high by historical standards, they were higher in October 1987.
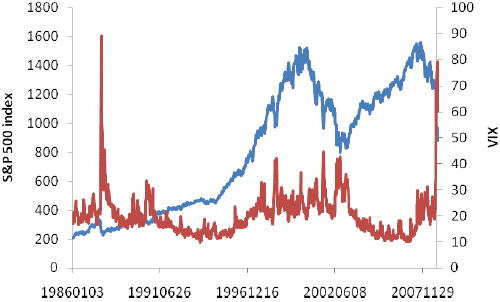
The following chart, taken from the paper, compares the behavior of the S&P 500 index and VIX over the entire history of VIX based on weekly closing levels. VIX reached its record high during the October 19, 1987 market crash, exceeding a level of 100. VIX frequently spikes upward during events that trigger stock market nervousness. In the aftermath of spikes, VIX reverts to more normal levels. Although VIX and the S&P 500 index appear generally to move in opposite directions, there are times when stock prices and volatility advance together. Investors can become nervous during market advances.

In summary, VIX is a roughly mean-reverting and asymmetrical measure of the price of stock portfolio insurance, and that price is empirically reasonable.