Do low-beta equity strategies work differently for industries and countries compared to individual stocks? In their January 2013 paper entitled “The Low Risk Anomaly: A Decomposition into Micro and Macro Effects”, Malcolm Baker, Brendan Bradley and Ryan Taliaferro decompose the low-beta anomaly into individual stock (micro) and industry/country (macro) components. To study individual stock versus industry effects, they use a long sample (48 years) of data for U.S. stocks, with betas estimated over lagged 60-month intervals from monthly excess returns (relative to U.S. Treasury bills). To study individual stock versus country effects, they use a shorter sample (about 22.5 years) of data for developed market (including the U.S.) stocks, with betas estimated over lagged 60-week intervals from weekly excess returns. Their principal performance metrics are: (1) gross one-factor (excess market return) alpha; and, (2) the difference in gross alphas between the value-weighted lowest-beta and highest-beta fifths (quintiles) of assets, reformed monthly. They decompose effects for individual stocks and industries/countries via double-sorts. Using monthly returns, SIC codes and market capitalizations for U.S. common stocks during January 1963 through December 2011, and both weekly and monthly returns and market capitalizations for common stocks from 30 developed country stock markets as available during July 1989 through January 2012, they find that:
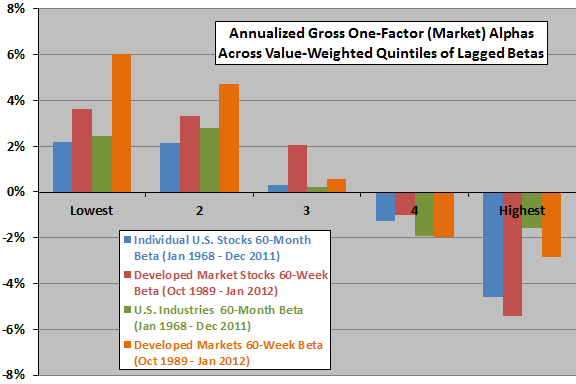
- In general, low lagged betas tend to outperform high lagged betas for individual U.S. stocks, individual developed market stocks, U.S. industries and developed markets (see the chart below).
- For U.S. stocks during 1968 through 2011 based on 60-month lagged betas, the pure individual stock (industry) contribution to the difference between low-beta quintile and high-beta quintile annualized gross alphas is 3.9% (2.2%). However, because these two sources of outperformance interact strongly, investors can capture nearly all of both contributions sorting only on individual stock betas (but not sorting only on industry betas).
- For developed market stocks during October 1989 through January 2012 based on 60-week lagged beta, the pure individual stock (country market) contribution to low-beta outperformance is 6.6% (8.6%). Because the two effects are materially independent, investors must consider both aspects of beta to exploit their combined effects.
- The low-beta strategy for individual stocks (industries/countries) delivers significantly lower risk with modest change in return (significantly higher return with modest change in risk).
The following chart, constructed from data in the paper, summarizes annualized gross one-factor (market) alphas by ranked fifths (quintiles) of lagged betas (calculated over either the past 60 months or the past 60 weeks) for four sets of assets over available sample periods. Results indicate that low-beta beats high-beta pervasively on a gross basis, but that outperformance is weakest and least systematic for industries.
As noted above, beta effects for individual U.S. stocks largely subsume beta effects for U.S. industries. However, beta effects for developed market stocks and country markets are materially independent.
 In summary, evidence indicates that investors can exploit the low-beta anomaly in the U.S. equity market (world equity market) largely at the individual stock level (only by combining individual stock and country effects).
Cautions regarding findings include:
- Reported alphas are gross, not net. Including reasonable trading frictions, which may be substantial for monthly portfolio reformation, would reduce these alphas. If trading frictions vary with beta, net findings may differ from gross findings.
- Analyses essentially use indexes rather than tradable assets for industries and country markets. Including reasonable costs for creating and maintaining funds that proxy for these indexes would reduce reported returns.
- The study does not account for data collection and processing burdens associated with monthly calculation of betas for large numbers of stocks. The study apparently also does not account for any delay between calculations and portfolio actions.