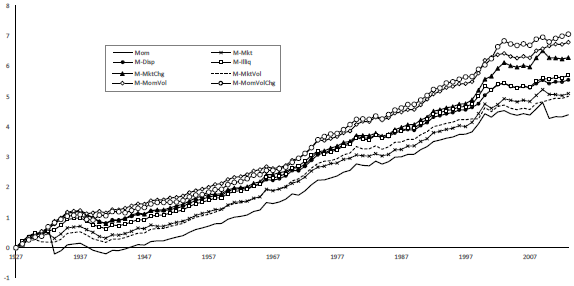
Which stock momentum return predictor works best? In his March 2015 paper entitled “Momentum Crash Management”, Mahdi Heidari compares the crash protection effectiveness of seven stock momentum return predictors, categorized into two groups:
- Overall stock market statistics: prior-month market return; change in monthly market return; volatility of market returns (standard deviation of weekly returns for the past 52 weeks); cross-sectional dispersion of daily stock returns for the past month; and, market illiquidity (value-weighted average of the monthly averages of daily price impacts of trading for all stocks).
- Momentum return series statistics: volatility of momentum returns (standard deviation of monthly returns over the past six months); and monthly change in volatility of momentum returns.
He measures momentum conventionally by first ranking all stocks by their returns from 12 months ago to one month ago and then after the skip-month forming a hedge portfolio that is long (short) the value-weighted tenth of stocks with the highest (lowest) past returns. He next tests the power of the above seven variables to predict the resulting monthly momentum return series. Finally, he tests dynamic momentum risk management strategies that execute the conventional momentum strategy (go to cash) when each of the seven predictors is below (above) the 90 percentile of its values over the last five years. Using daily and monthly returns, daily trading volumes and shares outstanding for a broad sample of U.S. common stocks during January 1926 through December 2013, he finds that:
- Over the entire sample period, the conventional momentum hedge portfolio has average monthly gross return 1.38%, annualized gross Sharpe ratio 0.59 and monthly gross three-factor (market, size, book-to-market) alpha 1.88%. It has negative skewness and high kurtosis, indicating a tendency to crash.
- All seven predictors relate negatively to momentum returns. Monthly change in volatility of momentum returns has the highest R-squared statistic, explaining 12% of the variation in momentum returns. Change in volatility of momentum returns and change in market return are most robust to controlling for other predictors and common risk factors.
- Gross annualized Sharpe ratios of all seven dynamic strategies that seek to avoid momentum crashes are higher than that of the static conventional strategy, ranging from 0.68 for prior-month market return to 1.10 for monthly change in volatility of momentum returns (see the chart below).
- Most of the power of the predictors comes from:
- 60 momentum crash months (returns less than -10%).
- The loser side of the hedge portfolio.
- Hedge portfolio turnover for the dynamic strategies ranges from 84% to 104% of that for the static conventional strategy.
The following chart, taken from the paper, compares logarithms of gross cumulative returns for the static conventional momentum hedge portfolio (Mom) and the seven dynamic strategies that seek to avoid momentum crashes. The dynamic strategy based on monthly change in volatility of momentum returns generates the strongest performance.

In summary, evidence indicates that investors may be able to improve the performance of a stock momentum hedge portfolio by using monthly change in volatility of momentum returns as a signal to avoid momentum crashes.
Cautions regarding findings include:
- Reported performance metrics are gross, not net. Including costs of monthly portfolio reformation and costs of shorting would reduce performance. Shorting may not be feasible for some stocks. The author does use turnover to compare implementation burdens for different strategies, but does not quantitatively assess impact on strategy performance because “analyzing exact amount of transaction costs for each strategy is not doable with available data…”
- Since most of predictor effectiveness comes from the short side of the hedge portfolio, the predictors are likely less effective for long-only momentum portfolios.
- There are sources of data snooping bias in the study methodology, as follows:
- Testing one static and seven dynamic momentum strategies on the same data introduces model snooping bias, such that the best-performing strategy overstates expectations.
- Selecting the 90th percentile threshold and associated five-year historical interval for the dynamic strategies may involve snooping.
- The methodology and associated portfolio implementation are likely too complex for many investors, who would bear a fee for delegating the process to a manager.