Implied idiosyncratic volatility is the “investor fear gauge” or perceived risk for an individual stock based on the pricing of its associated options, as contrasted with: (1) overall stock market volatility as measured by variables such as the CBOE Volatility Index (VIX); and, (2) realized idiosyncratic volatility based on variation of the stock’s historical price. Can investors use the return due this perceived risk in an individual stock as a building block in constructing outperforming portfolios? In their December 2006 paper entitled “Idiosyncratic Implied Volatility and the Cross-Section of Stock Returns”, Dean Diavatopoulos, James Doran and David Peterson examine the relationship between idiosyncratic implied volatility and 30-day, 60-day and 91-day future returns for different kinds of equities. Using daily data on 240 stocks with actively traded options for the period January 1996 to June 2005, they find that:
- Implied idiosyncratic volatility reliably predicts realized idiosyncratic volatility, with an upward bias, suggesting that investors/traders demand a premium for holding stocks with high implied volatilities.
- Implied idiosyncratic volatility does, in fact, correlate positively with future stock returns. Realized idiosyncratic volatility is unrelated to future returns.
- Both total and idiosyncratic implied volatilities significantly predict future stock returns, even after controlling for macroeconomic conditions and realized idiosyncratic volatility. Neither idiosyncratic nor total market realized volatilities are significantly predictive.
- For equal-weighted stock portfolios, implied idiosyncratic volatility strongly predicts future returns across size and book-to-market cross-sections (see charts below). For value-weighted portfolios, the predictive power is less strong.
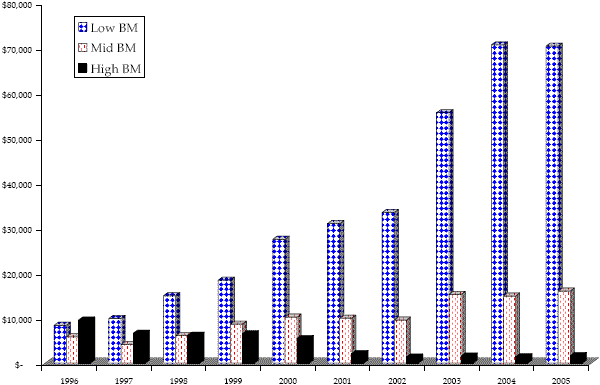
The following chart, taken from the paper, presents the cumulative values of initial (January 1996) $10,000 investments in three value-weighted portfolios that are long stocks in the top third of implied idiosyncratic volatilities and short stocks in the bottom third, reformed every 30 days through June 2005. The three portfolios are low book value-to-market value (BM), medium BM and high BM. The portfolios exclude stocks priced $5.00 or lower. The chart suggests that the implied volatility premium is positive for low BM (growth) stocks and negative for high BM (value) stocks. Note that the overall sample of only 240 stocks with actively traded options may produce value versus growth breakdowns different from those in studies with larger samples.

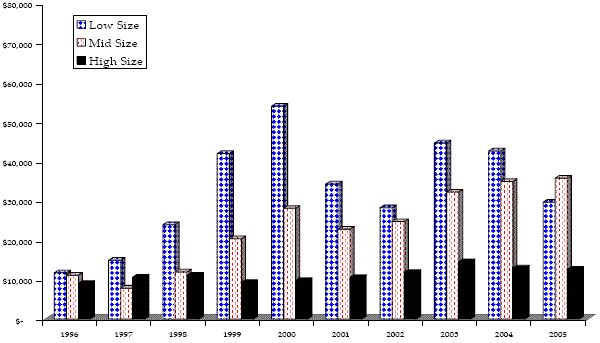
The next figure, also from the paper, presents the cumulative values of initial (January 1996) $10,000 investments in three value-weighted portfolios that are long stocks in the top third of implied idiosyncratic volatilities and short stocks in the bottom third, reformed every 30 days through June 2005. These three portfolios are small, medium and large capitalizations. The portfolios exclude stocks priced $5.00 or lower. The chart suggests that the implied volatility premium is concentrated in the stocks of small and medium-sized companies. Note that the overall sample of only 240 stocks with actively traded options may produce size breakdowns different from those in studies with larger samples.

In summary, the volatility premium for individual stocks derives from volatilities implied by options prices rather than historical (realized) stock price volatilities. This premium may be concentrated in small growth stocks.
See the CBOE Trading Tools for simple implied and historical volatility data.