“Option-implied Correlation as Stock Market Return Predictor” finds that implied correlation for a broad stock market index relative to its components may be useful for predicting equity market returns. To corroborate, we look at the readily available CBOE S&P 500 Implied Correlation Indexes. The indexes are a series of three based on sequential pairings of December S&P 500 Index options and January options for the 50 largest S&P 500 stocks with maturities of about one and two years, so two of the three are active at any time. CBOE discontinues calculation of the “near” series as the options approach maturity in November and starts a new “far” series. Presumably, investors are overly pessimistic (optimistic) about future opportunity for diversification when the indexes are high (low). Using daily levels of the available 12 implied correlation index two-year series and daily returns of the S&P 500 Index during January 2007 through mid-February 2017, we find that:
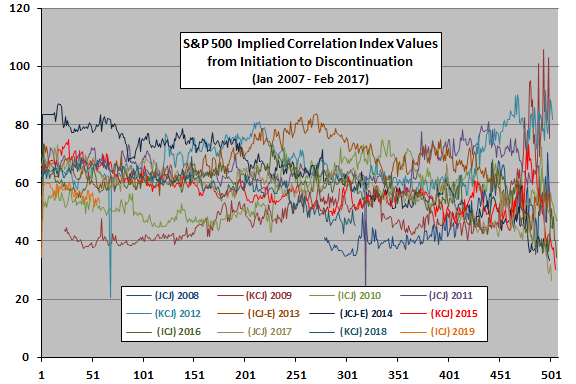
The following chart tracks daily levels of the 12 S&P 500 Implied Correlation Indexes two-year series as available from specified start (trading day 1) to specified discontinuation (about trading day 500). The chart indicates that:
- S&P 500 implied correlation as specified varies between about 40 and about 80.
- There is no obvious pattern over the life of an two-year series, except that volatility and range of values increases as it approaches discontinuation (expirations of underlying options).
- There may be a few anomalies/errors in data.
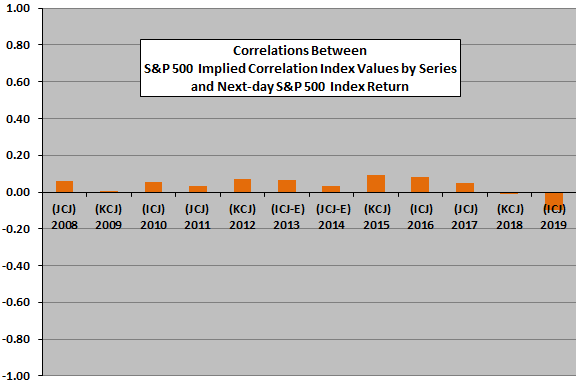
To investigate index return predictive power, we relate levels of S&P 500 Implied Correlation Indexes to next-day S&P 500 Index return by series.
The next chart summarizes correlations between levels of each series of available S&P 500 Implied Correlation Indexes and next-day S&P 500 Index return. Most correlations are positive, as presumed. However, all correlations are small in magnitude, magnitudes vary and the last two (for incomplete series) are negative.
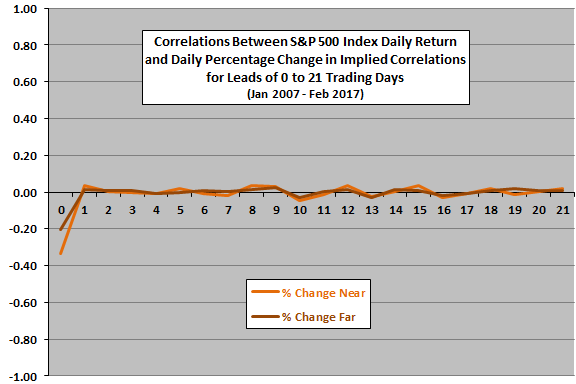
To construct a continuous series over the entire sample period, we relate daily changes in the active near and far S&P 500 Implied Correlation Indexes to daily S&P 500 Index returns over the next month.
The final chart summarizes correlations between daily changes in near and far S&P 500 Implied Correlation Indexes and S&P 500 Index return for each of the next 21 trading days. There are two-gaps in the former series when one near series ends and a replacement far series starts. Day 0 is the contemporaneous correlation. Presumably, an increase (decrease) in implied correlation should relate to higher (lower) future returns and therefore generally positive correlations.
However, the chart shows that all correlations are close to zero, with no observable positive bias. In the absence of any promising statistical relationships, attractiveness of any market timing strategies based on S&P 500 Implied Correlation Indexes seems unlikely.
In summary, evidence from simple tests offers little corroboration for the finding that implied correlation for a broad stock market index relative to its components usefully predicts index returns at horizons up to a month.
Cautions regarding findings include:
- Results for longer prediction horizons may be stronger. However, using the available S&P 500 Implied Correlation Indexes for longer horizons is problematic because:
- The overall sample period is not long.
- Time to maturity decreases as each index ages, and there are discontinuities in data as old indexes stop and new ones start.
- There may be some strategy based on S&P 500 Implied Correlation Indexes that perform attractively. However, the basic statistics above are unpromising, and varying test setups/parameters to find one that works introduces data snooping bias, such the best-performing variation overstates expectations. The more exploration, the greater the bias.