Is the market beta of a stock stable across measurement frequencies and measurement intervals? In their October 2014 paper entitled “Which Is the Right ‘Market Beta’?: 1,385 US Companies and 147 Betas/Company in a Single Date”, Jose Paulo Carelli, Pablo Fernandez, Isabel Fernandez Acín and Alberto Ortiz present calculations of 147 betas relative to the S&P 500 Index for each of the S&P 1500 stocks with at least five years of return data on March 31, 2014. They calculate different betas based on monthly, weekly or daily returns over past intervals of one to five years. They then look at the dispersion of each stock’s beta and beta ranking across calculation methods (see the chart below for an example). In assessing dispersion, they focus on the difference between maximum and minimum values by stock. Using daily, weekly and monthly returns for 1,385 stocks and the S&P 500 Index during April 2009 through March 2014, they find that:
- For all 1,385 stocks, the average (median) difference between maximum beta for a stock and minimum beta for a stock across beta calculation methods is 1.17 (1.03).
- For the 30 companies with biggest market capitalizations, the average (median) difference between maximum beta for a stock and minimum beta for a stock across beta calculation methods is 0.81 (0.72).
- In comparing betas of any two companies A and B, it is consistently possible to find one beta calculation method that assigns A the higher beta and another that assigns B the higher beta.
- In ranking all 1,385 companies by beta, the average difference in maximum ranking for a stock and minimum ranking for a stock across beta calculation methods is 786.
- There are 782 (723) stocks with average daily beta across measurement intervals higher than average weekly (monthly) beta across measurement intervals. In other words, there is no reliable relationship between beta value and beta measurement frequency.
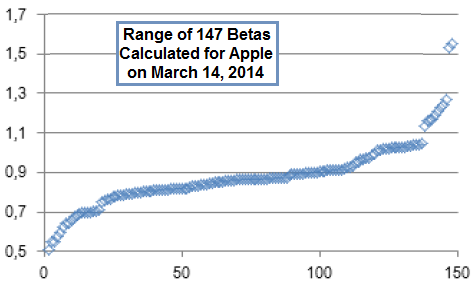
The following chart, taken from the paper, illustrates the range of 147 betas calculated on March 14, 2014 for Apple Inc. relative to the S&P 500 Index based on daily, weekly or monthly returns over past intervals of one to five years. The highest (lowest) calculated beta is 1.55 (0.50), for a difference of 1.05. The average of the 147 betas is 0.88, with standard deviation 0.16.
In summary, evidence indicates that different ways of calculating the market beta for U.S. stocks produce, at a given point in time, very different betas and beta rankings.
Results suggest that beta calculation method snooping may be able to discover apparently large but spurious relationships between beta and other variables.
See also “Unreliability of Beta” and “Forget CAPM Beta?”.