Does unusual behavior of the distribution of stock betas predict overall market behavior? In her March 2017 paper entitled “Beta Dispersion and Market-Timing”, Laura-Chloé Kuntz investigates the attractiveness of stock market timing strategies based on the dispersion of stock betas. She calculates betas using rolling windows of three or 12 months of daily returns. She considers two potential predictors derived from the distribution of betas: Beta Dispersion (BD), specified as the average of the top 5% of betas minus the average of the bottom 5% of betas; and, High Beta (HB), specified as the average of the top 5% of betas. Using S&P 500 stocks and the S&P 500 Index, she constructs a distribution of stock market return forecasts based on BD or HB for horizons of one, three or 12 months based on regressions relating past beta indicator to future stock market returns. She then tests three stock market timing strategies on the S&P 500 Index:
- Basic – each month hold the S&P 500 Index (1-month U.S. Treasury bills) if next-period forecasted returns are likely positive (negative).
- Unweighted – each month go long (short) the S&P 500 Index if next-period forecasted returns are likely positive (negative).
- Weighted – each month go long (short) the S&P 500 Index according to the probability of positive (negative) index return based on the historical forecast distribution, with the balance in 1-month U.S. Treasury bills.
Using monthly returns of S&P 500 Index stocks and the S&P 500 Index and monthly 1-month U.S. Treasury bill yield (as the risk-free rate, or cash yield) during September 1989 through September 2016, she finds that:
- In general:
- Extreme widening of beta dispersion coincides with a strong concentration of high-beta stocks in one or a few sectors.
- The specified BD and HB stock market return predictors work best at an intermediate-term horizon rather than a short-term horizon.
- The predictive powers of BD and HB are incremental to those of Consumption, Asset Wealth and Labor Income (CAY), dividend yield and short interest rate.
- 34 of 36 market timing strategy variations based on BD and HB predictors noticeably boost gross annualized Sharpe ratio compared to buy-and-hold (0.48), largely by reducing the return volatility (see the chart below).
- For both the Basic and Unweighted strategy variations, average gross annual returns (11.7%-13.3%) and gross annualized Sharpe ratios (0.69-0.74) are highest for the HB predictor with betas calculated from 12 months of historical returns and 1-month or 3-month forecast horizons. These variations moderately suppress volatility compared to buy-and-hold, with maximum drawdowns only 6%-10%.
- For Weighted strategy variations, average gross annual returns (11.3%-12.0%) and gross annualized Sharpe ratios (0.87) are highest for the BD and HB predictors with betas calculated from 12 months of historical returns and a 12-month forecast horizon. These variations dramatically suppress volatility compared to buy-and-hold, with maximum drawdowns only 5%-7%.
- The Basic and Unweighted strategies generate stocks-cash and long-short switches only a few times in 27 years, such that switching frictions are negligible over the sample period. The Weighted strategy rebalances monthly, such that frictions are material and signal buffers may be valuable for optimizing net performance.
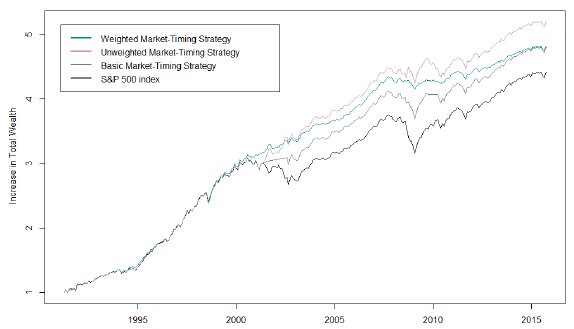
The following chart, taken from the paper, compares cumulative growth of $1 initial investments in each of four strategies: the Basic, Unweighted and Weighted strategies as specified above and applied to the S&P 500 based on the 12-month forecast horizon for the BD predictor, with betas calculated from the last 12 months of daily returns; and, buying and holding the S&P 500 Index. Notable points are:
- Basic and Unweighted strategies simply hold the S&P 500 Index until 2001, and the Unweighted strategy differs little from the index. There are no market crashes during this decade.
- Outperformance of the BD strategies concentrates during the equity market crashes of 2000-2002 and 2008. In other words, the strategies are essentially crash avoidance/exploitation.
In summary, evidence indicates that stock beta dispersion and the average beta of high-beta stocks may be useful equity market crash indicators, useful as a market timing tool to lower portfolio volatility and increase Sharpe ratio.
Cautions regarding findings include:
- As noted in the paper, performance results are gross, not net. Switching frictions are of little concern for the Basic and Unweighted strategies, but may be material for the Weighted strategy.
- Testing of 36 strategy variations (combinations of different beta calculation intervals, BD versus HB and forecast horizons) on the same data introduces data snooping bias, such that the best-performing variations overstate expectations.
- The author asserts that S&P 500 Index futures and exchange-traded funds (ETF) enable execution of the strategies presented at low cost. However, futures (with continual rolling) and inverse ETFs may behave differently from the underlying index.