Does adjusting leverage based on lagged strategy volatility protect an industry momentum strategy from crashes? In their September 2016 paper entitled “Risk-Managed Industry Momentum and Momentum Crashes”, Klaus Grobys, Joni Ruotsalainen and Janne Aijo investigate the profitability of risk-managed industry momentum strategies. Their asset universe consists of the 49 Fama-French value-weighted industry portfolios. They focus on a conventional momentum strategy that each month takes equally weighted long positions in past winners (top eight industries) and short positions in past losers (bottom eight industries) based on cumulative returns from 12 months ago to one month ago (12-2). They also analyze 6-2 and 12-7 variations to determine whether more recent or older past returns drive results. For risk management, they forecast next-month momentum strategy volatility based on past strategy volatility calculated based on daily returns over the past one, three or six months. They apply the volatility forecasts to determine the portfolio leverage required to target constant 12% annualized volatility. Using monthly and daily returns for the 49 industries during July 1926 through September 2014, they find that:
- Without risk management, the 12-2, 6-2 and 12-7 industry momentum strategies generate average gross monthly returns over the sample period of 1.06%, 0.76% and 0.77%, respectively, corresponding to annualized gross Sharpe ratios of 0.56, 0.44 and 0.42.
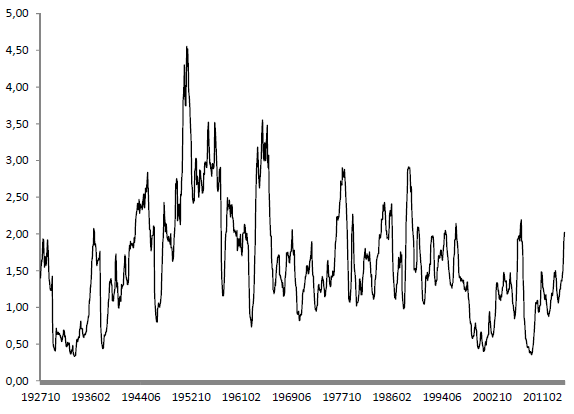
- For the 12-2 strategy with risk management based on a six-month historical volatility estimation window, portfolio leverage ranges from 0.34 to 4.55 over the sample period (see the chart below).
- Risk-managed industry momentum strategies outperform their unmanaged counterparts, with incrementally larger average gross monthly return improvements as the historical volatility estimation window shrinks from six months to three months to one month:
- For the 12-2 strategy, risk management boosts average gross monthly return to the range 1.65%-1.92% and gross annualized Sharpe ratio to the range 0.69-0.72.
- For the 6-2 strategy, risk management boosts average gross monthly return to the range 1.30%-1.43% and gross annualized Sharpe ratio to the range 0.59-0.63.
- For the 12-7 strategy, risk management boosts average gross monthly return to the range 1.14%-1.33% and gross annualized Sharpe ratio to the range 0.52-0.54.
- Risk-managed versions exhibit gross performance improvements over unmanaged counterparts during two subperiods with break point at the end of July 1971.
The following chart, taken from the paper, plots the investment weight (leverage) for the 12-2 momentum portfolio with six-month historical volatility estimation window to target constant 12% annualized volatility over the sample period. Leverage ranges from 0.34 to 4.55.
In summary, evidence indicates that scaling leverage up (down) when recent strategy volatility is low (high) may improve the performance of an industry momentum strategy.
Cautions regarding findings include:
- The 49 industry “portfolios” are effectively indexes that do not account for the costs of forming and maintaining liquid funds. Such costs would reduce industry returns.
- Results do not account for the costs of monthly industry switching or any costs of shorting industry portfolios. Shorting may have been costly or infeasible for many stocks in these portfolios.
- Results assume unrestricted, zero-cost leverage (short side funds long side of portfolios without limit).
- Specified leverage is sometimes so high that modest model/estimation errors may be very dangerous.
- Testing multiple strategy variations based on different momentum calculation intervals and different volatility forecast estimation windows on the same data introduces snooping bias, such that the best-performing variations overstate expectations. The six ranges for momentum and 12% annualized volatility target may be snooped.
See “Avoiding Momentum Strategy Crashes” for application of this methodology to individual stock momentum rather than industry momentum.