Risk-focused asset allocation strategies derive from evidence that forecasting asset return volatility is easier than forecasting average return. Is there a best risk-focused strategy? In his September 2012 paper entitled “A Small Survey of Quantitative Models that Discard Estimation of Expected Returns for Portfolio Construction”, Stefano Colucci compares asset allocation strategies that rely on forecasted asset risk metrics but not on forecasted average returns. Specifically, he compares future gross annualized return-risk ratios, Ulcer indexes, one-month maximum drawdowns and average monthly portfolio turnovers for the following asset allocation strategies:
- Minimum Variance (least volatile, or left-most, efficient portfolio per Modern Portfolio Theory).
- Minimum Expected Shortfall with weightings estimated by Monte Carlo simulation.
- Equal Risk Contribution (each asset weighted by the inverse of its forecasted maximum expected shortfall).
- Maximum Diversification (related to expected shortfall with weightings again estimated by numerical simulation).
- Risk Parity (each asset weighted by the inverse of its portfolio volatility contribution).
- Equal Weighting (requiring neither average return nor volatility forecasts) as a benchmark.
He reforms portfolios every 20 trading days (approximately monthly) and estimates future risk metrics based on a rolling historical window of 500 trading days (approximately two years). Using daily returns over recent periods for stock and bond indexes and individual stocks segregated into several asset selection universes, he finds that:
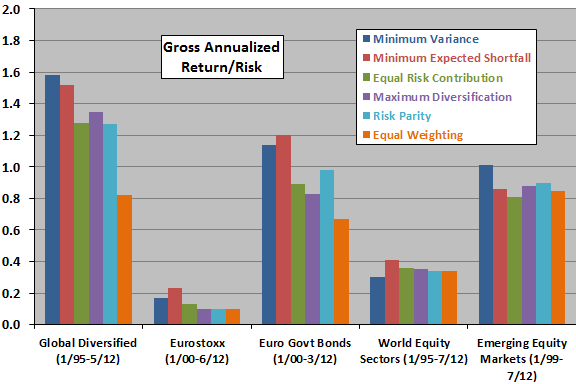
- Based on gross annualized risk-return ratio (see the first chart below):
- Strategies that seek to minimize portfolio risk metrics perform well in most asset universes.
- Strategies that seek to spread risk across assets are in the middle of the pack.
- Equal Weighting offers poor to middling performance.
- Equal Weighting has a relatively high Ulcer Index and relatively large one-month maximum drawdown, while Minimum Variance and Minimum Expected Shortfall suppress these drawdown measures.
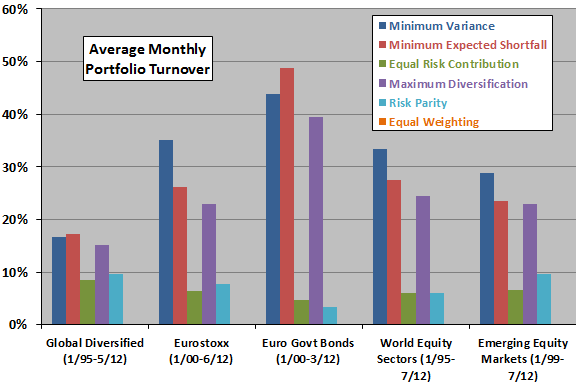
- Based on average monthly portfolio turnover (see the second chart below):
- Equal Weighting excels with very low turnover.
- Strategies that seek to spread risk across assets have relatively low turnover.
- Strategies that seek to minimize risk have relatively high turnover that may materially impair net performance.
The following chart, constructed from data in the paper, summarizes annualized gross return-risk ratios for the six asset allocation strategies as applied to five distinct universes of assets. Strategies that aim to minimize future portfolio risk often outperform, while the benchmark Equal Weighting is unimpressive.

The next chart, also constructed from data in the paper, summarizes average monthly portfolio turnovers for the six asset allocation strategies as applied to five distinct universes of assets. Strategies that generate the best gross return-risk ratios above also have the highest portfolio turnovers, while the benchmark Equal Weighting has the lowest turnover (the study ignores marginal monthly rebalancing turnover for Equal Weighting).

For simplicity, the above charts exclude an alternative Equal Risk Contribution allocation strategy and an asset universe consisting of Italian bonds and global equities.
In summary, evidence indicates that the tradeoff between gross performance and turnover may be crucial in selecting an asset allocation strategy, with strategies designed to minimize portfolio risk metrics attractive for the former but not the latter.
Cautions regarding findings include:
- The study ignores the data collection and calculation burdens (or fees if delegated) for the compute-intensive allocation strategies.
- As clearly stated in the paper, projected returns are gross. Incorporating reasonable trading frictions would reduce returns. Since the strategies with the highest (lowest) gross return-risk ratios tend to have the highest (lowest) turnovers, findings based on net returns may differ.
- Except for the Eurostoxx asset universe, the study uses indexes as assets. Incorporating the trading frictions and management fees required to create tradable funds from these indexes would reduce returns.
- Applying multiple allocation strategies to the same asset universes introduces data snooping bias, such that the best (worst) strategies tend to overstate (understate) expectations for future performance. There may also be snooping bias in selection of parameters such as the length of the historical rolling window for risk metric estimation.
- Sample periods are not long in terms of secular financial market conditions.