
Does the gap between the (sentiment-driven?) options-implied volatility and the (data-driven) expected volatility of the broad equity market predict future stock returns? In the May 2009 version of his paper entitled “Variance Risk Premia, Asset Predictability Puzzles, and Macroeconomic Uncertainty”, Hao Zhou examines the predictive power of this gap based on several ways to derive expected volatility from realized volatility. Using monthly values of the Chicago Board of Options Exchange Volatility Index (VIX) to calculate implied volatility and high-frequency intraday S&P 500 Index levels to calculate realized volatility over the period 1990-2008, along with contemporaneous data for traditional market predictors, he concludes that:
- The gap between implied and expected volatilities (the variance or volatility risk premium) relates significantly and positively to short-term future equity returns and bond returns.
- Predictive power is strongest at forecast horizons of one to three months (with adjusted R-squared statistics indicating explanatory power of a few percent), and then diminishes as forecasting horizon increases.
- This short-term return predictability complements the long-term forecasting power of price-to-earnings ratio and interest rates such that combining the volatility risk premium with these indicators enhances overall predictive power.
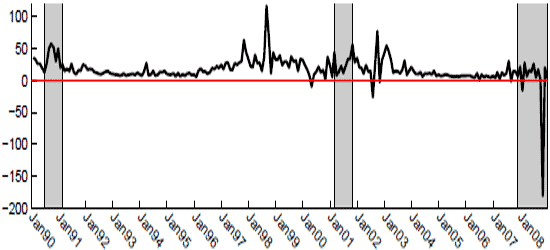
The following figure, taken from the paper, plots the volatility risk premium (gap between implied and expected volatilities) for the S&P 500 Index during 1990-2008 using lagged realized volatility as the expected volatility. Shaded areas indicate NBER recessions. This gap is relatively large during the 1990 and 2001 recessions and very large during the 1997-1998 Asia-Russia-Long-Term Capital Management crises and 2002-2003 corporate accounting scandals. The extreme dip in the volatility risk premium during the current recession occurs in October 2008.
The paper offers several similar plots for alternative measures of the expected volatility of the S&P 500 Index.
In summary, evidence suggests that the fear-driven gap between option-implied volatility and contemporaneous realized volatility for a broad stock market index may offer investors/traders a small edge in anticipating near-term stock and bond returns.
Note that predictability significance measures in this study assume normality of asset return distributions (empirically disputable) and that statistical significance here translates into just a small (difficult to confirm in trading) edge for monthly trading.
Frequently Asked Questions
What is the variance risk premium in the stock market?
The variance risk premium (also called the volatility risk premium) is the gap between options-implied volatility, such as that measured by the VIX, and the expected volatility of the market based on realized volatility. In the study, implied volatility is viewed as sentiment- or fear-driven, while expected volatility is data-driven. The gap was relatively large during the 1990 and 2001 recessions and very large during the 1997-1998 crises and 2002-2003 accounting scandals.
Does the gap between implied and realized volatility predict stock and bond returns?
The gap between implied and realized volatility (the variance risk premium) for the S&P 500 relates significantly and positively to short-term future equity and bond returns over 1990-2008. Predictive power is strongest at one to three months, with adjusted R-squared indicating explanatory power of a few percent, and it diminishes at longer horizons. Combining it with price-to-earnings ratio and interest rates enhances overall predictive power.
How is the implied-realized volatility gap calculated and tested as a return predictor?
The implied-realized volatility gap is calculated using monthly VIX values for implied volatility and high-frequency intraday S&P 500 Index levels for realized volatility, over 1990-2008. Expected volatility is derived from realized volatility in several ways, including lagged realized volatility, and the gap is tested against future stock and bond returns alongside traditional market predictors. Predictive power is assessed at multiple forecast horizons using adjusted R-squared statistics.
How does the volatility risk premium compare with the price-to-earnings ratio and interest rates for forecasting returns?
The volatility risk premium forecasts short-term returns (strongest at one to three months), whereas the price-to-earnings ratio and interest rates have long-term forecasting power. The study finds these predictors complement each other, so combining the volatility risk premium with the price-to-earnings ratio and interest rates enhances overall predictive power. The volatility risk premium's influence diminishes as the forecasting horizon lengthens.
What are the limitations of using the implied-realized volatility gap to predict returns?
The significance measures for the implied-realized volatility gap assume normally distributed asset returns, which is empirically disputable. The explanatory power is only a few percent, so statistical significance translates into a small edge for monthly trading that is difficult to confirm in practice. The evidence also covers only 1990-2008 and the S&P 500 Index.