Beta measures the volatility of a stock with respect to the broad market. However, after accounting for the value premium and size effect, the generally accepted beta has no predictive power for future stock returns. Is that all there is to beta? In their May 2007 paper entitled “Long-Term and Short-Term Market Betas in Securities Prices”, Gerard Hoberg and Ivo Welch decompose beta into short-term (the last 12 months) and long-term (one to ten years ago) components and investigate whether these components can separately forecast stock returns. Using daily stock prices and financial data for a large sample of companies (an average of over 3,300 firms per month) over the period 1962-2005, they find that:
- Beta computed from stock returns over the most recent 12 months relates negatively to future returns. High (low) short-term beta indicates low (high) future returns.
- Beta computed from stock returns that are one to ten years old relates positively to future returns. High (low) long-term beta indicates high (low) future returns.
- A portfolio with long-term betas in the top 20% and short-term betas in the bottom 20% outperforms its mirror image by an annualized 7.5% per year. (See the table below.) Among stocks with high short-term betas, those with high long-term betas outperform those with low long-term betas by 5.5% per year.
- Prior research using betas calculated with the most recent five years of returns misses the difference between short-term and long-term betas because this difference tends to cancel and because betas based on monthly stock returns lack discrimination power.
- The short-term and long-term beta effects are not proxies for size, value or momentum factors. They hold for large and small firms, for value and growth firms, and for firms with low, medium or high past-year returns. In fact, beta effects are somewhat stronger after controlling for size and value.
- Beta effects are generally stable over time, even somewhat stronger in recent years, and across different market conditions.
- The best explanation for these findings may be that short-term beta represents some new risk factor and long-term beta captures a premium paid by those who use beta as a hedging tool.
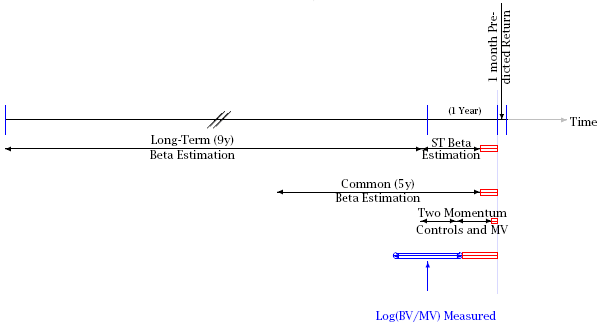
The following figure, taken from the paper, depicts the intervals the authors employ to calculate short-term and long-term betas, as well as other factors used in the study. The authors update portfolios and statistics monthly using the latest available data. Red boxes mark periods for which they assume, to avoid any look-ahead bias, that data is not yet available for updates. Study results are not notably sensitive to the exact break point between the short-term and long-term beta intervals.

The following table, also from the paper, shows future annualized stock returns for different groups of stocks sorted by both short-term beta and long-term beta. For example, the group of stocks in both the 20% of stocks with the lowest (highest) short-term beta and the 20% of stocks with the highest (lowest) long-term beta has an annualized return of 12.7% (5.2%). A zero-cost portfolio that is long the former and short the latter generates an annual return of 5.5%, excluding transaction costs. Note that the long-term beta effect varies more consistently than the short-term effect.

In summary, stock betas change over time, and strategies that track these changes with high-frequency data can generate abnormal returns. Stocks with long-term high (low) but recently decreasing (increasing) betas are buys (sells).
One plausible explanation for these results is that investors respond slowly to changes in stock betas.