Does the U.S. stock market volatility risk premium (VRP), measured as the difference between the volatility implied by stock index option prices recent actual index volatility, usefully predict stock market returns? To investigate, we consider a simple VRP specification: S&P 500 Implied Volatility Index (VIX) minus standard deviation of daily S&P 500 Index returns over the past 21 trading days. Since VIX is an annualized percentage, we annualize actual daily volatility by multiplying by the square root of 252. We then relate this simple VRP to future S&P 500 Index returns and apply a VRP-related signal to time SPDR S&P 500 (SPY). Using daily data for the S&P 500 Index since December 1989, VIX since January 1990, and SPY and 13-week U.S. Treasury bills (T-bill) since the end of January 1993, all through April 2016, we find that:
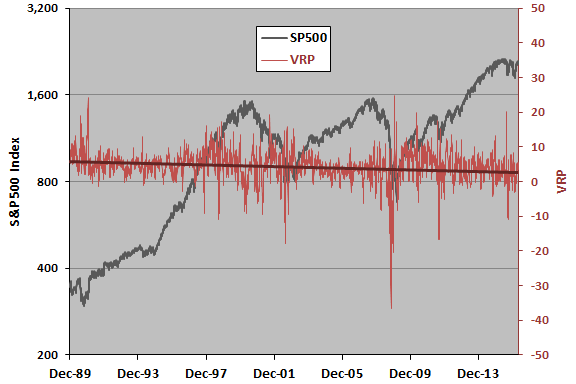
The following chart shows the S&P 500 Index (on a logarithmic scale) and VRP measured daily over the available sample period. VRP is positive 89% of the time, with average 4.21 and standard deviation 4.29. The linear trend line for VRP suggests that it is slowly decreasing. It is difficult to infer a relationship between the two series via visual inspection, but it appears that VRP may tend to go negative during sharp market declines.
For precision, we relate future S&P 500 Index returns to VRP.
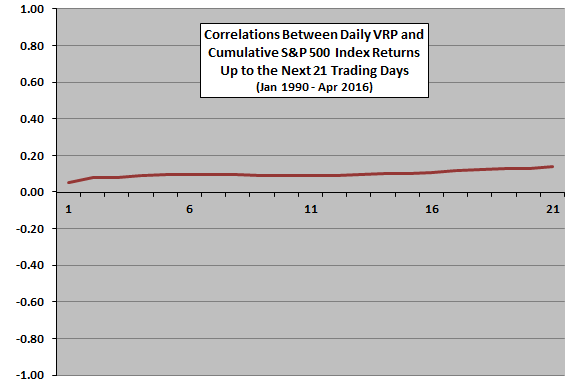
The next chart plots correlations between daily VRP and cumulative S&P 500 Index returns for the next one to 21 trading days over the entire sample period. Correlations are positive and grow with cumulative return, indicating that a high (low) daily VRP is good (bad) for the stock market with some persistence.
However, excluding data from the unusual subperiod of mid-2008 through mid-2009 cuts these correlations about in half.
For greater insight, we track average S&P 500 Index returns by ranges of VRP.
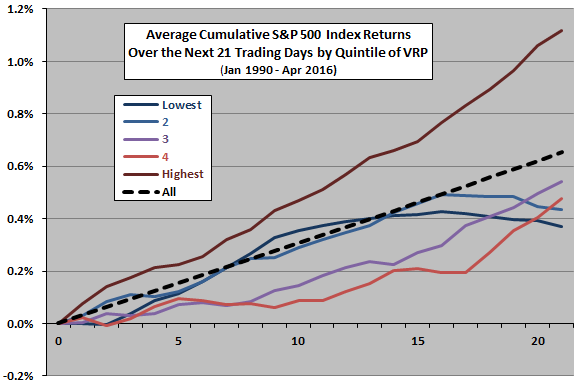
The next chart shows average cumulative S&P 500 Index returns over the next 21 trading days by ranked fifth (quintile) of daily values of VRP over the entire sample period. For example, the dark red “Highest” line depicts the average behavior of the index after the highest fifth of daily VRP values. There are 1,314 daily VRP observations per quintile, but both VRP and subsequent returns use overlapping data. The dashed black line is the average index performance over all intervals of 21 trading days in the sample period.
Results indicate that the stock market tends to be persistently strong during the 21 trading days after high VRP readings, but returns after other ranges of VRP are not systematic. None of the five quintile behaviors suggests shorting the stock market.
The average daily VRP for the Lowest (Highest) quintile is -1.66 (8.75), compared to 4.23 for all days.
This analysis is in-sample. An investor operating in real time would not know exact VRP quintile thresholds.
In case VRP involves more extreme tail effects, we look at the top and bottom 1% and 5% of values.
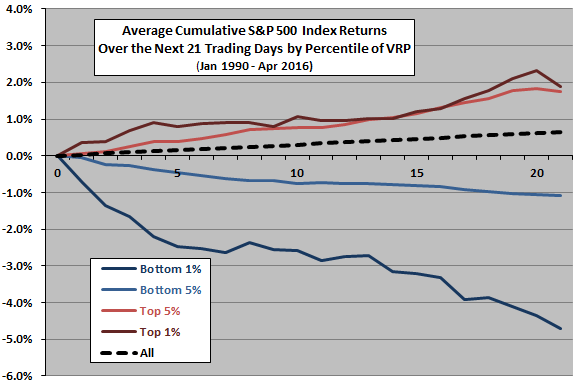
The next chart shows average cumulative S&P 500 Index returns over the next 21 trading days for the top and bottom 1% and top and bottom 5% of VRP values. There are 64 (319) VRP observations in the top/bottom 1% (5%), but they may involve overlapping data. The dashed black line is again the average index performance over all intervals of 21 trading days in the sample period.
The most dramatic result is the poor average market performance after extremely low (negative) values of VRP. The bottom 1% of VRP values concentrate in mid-2002, late 2008 (especially) and mid-2011 and involve overlapping observations (overstating sample size). And, this analysis is again in-sample. An investor operating in real time may not be able to identify extreme VRP values accurately.
Do these in-sample findings translate to an attractive trading strategy?
Based on in-sample findings, we consider a strategy that uses daily data to exit the stock market (proxied by SPY) when VRP is extremely low, hoping to avoid large negative returns. Specifically, this Daily VRP Strategy moves from SPY to cash on any day after VRP is two or more standard deviations below its inception-to-date average at the prior close. We assume:
- Slight anticipation of signals just before the close to allow trading at the same close.
- Cash earns the T-bill yield.
- Frictions for switching between SPY and cash is 0.1% of trade value.
- Tax implications of trading are not important.
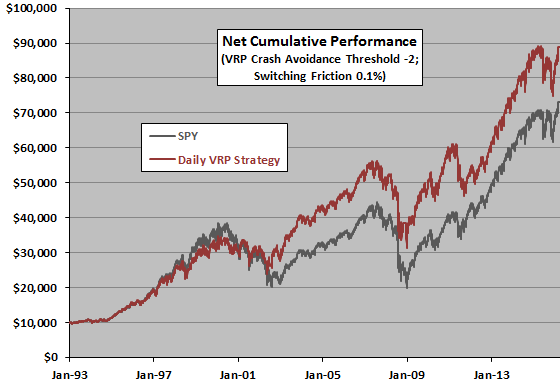
The following chart tracks net cumulative values of $10,000 initial investments in the Daily VRP Strategy and SPY buy-and-hold at the end of January 1993. Net compound annual growth rates (CAGR) are 9.9% and 8.9%, respectively. Maximum drawdowns (MaxDD) are -44% and -55%, respectively. As suggested by preceding tests, outperformance of the Daily VRP Strategy concentrates in 2002 and 2008.
Average daily return for the Daily VRP Strategy (SPY) is 0.043% (0.041%), with standard deviation of daily returns 1.10% (1.19%). Rough daily Sharpe ratio is therefore 0.039 (0.034).
The Daily VRP Strategy is in stocks 94% of the time. It switches between SPY and cash 139 times, so cumulative frictions are material. Shorting SPY (at no cost) rather than going to cash slightly hurts results.
How robust are results to the value of the threshold for “extremely low” VRP?
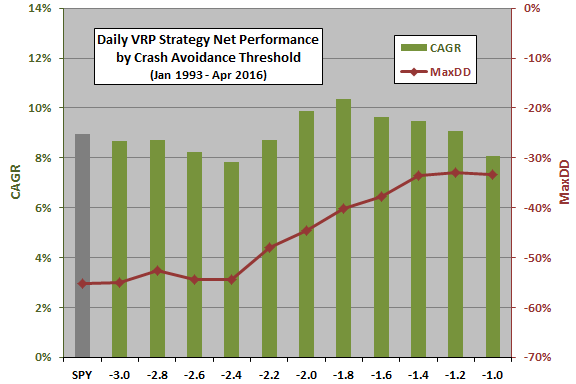
The next chart summarizes Daily VRP Strategy CAGR and MaxDDfor switching (crash avoidance) VRP thresholds ranging from at least one standard deviation (-1) to at least three standard deviations (-3) below its inception-to-date average. In general, raising the threshold reduces the depth of MaxDD. Variation in CAGR suggests that the optimal -1.8 threshold is lucky.
Does the strategy work better with month-end data only (Monthly VRP Strategy)?
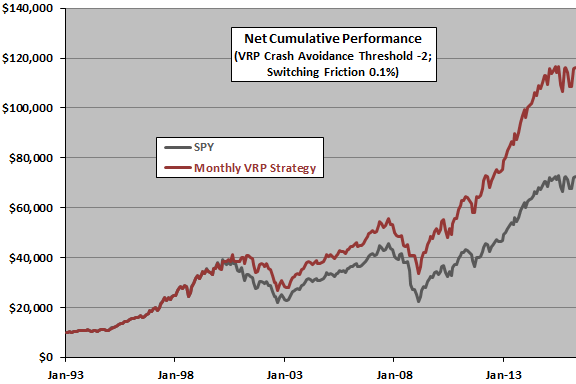
The next chart tracks net cumulative values of $10,000 initial investments in the Monthly VRP Strategy (based on a -2 threshold and 0.1% SPY-cash switching friction) and SPY buy-and-hold at the end of January 1993. CAGRs are 11.1% and 8.9%, respectively. MaxDDs are -40% and -51%, respectively. Outperformance appears less concentrated than that of the Daily VRP Strategy.
Average monthly return for the Monthly VRP Strategy (SPY) is 0.96% (0.80%), with standard deviation of monthly returns 3.93% (4.21%). Rough monthly Sharpe ratio is therefore 0.24 (0.19).
The Monthly VRP Strategy is in stocks 95% of the time. It switches between SPY and cash 21 times, so cumulative frictions are much lower than those for the Daily VRP Strategy (and tax implications friendlier).
Shorting SPY (at no cost) instead of going to cash boosts CAGR to 13.2% and moderates MaxDD to -35%.
How robust are results to the value of the threshold for “extremely low” VRP?
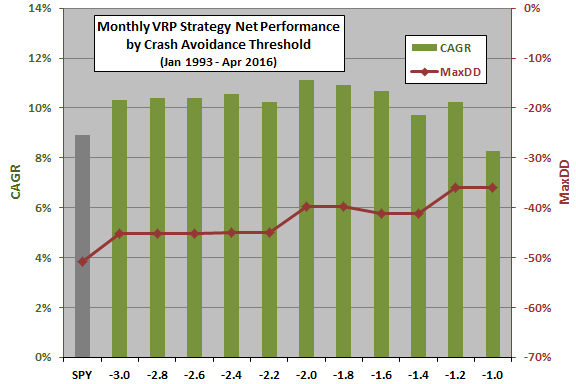
The final chart summarizes Monthly VRP Strategy CAGR and MaxDD for crash avoidance VRP thresholds ranging from at least one standard deviation (-1) to at least three standard deviations (-3) below its inception-to-date average. Raising the threshold mostly reduces the depth of MaxDD. The -2 threshold is optimal for CAGR, with outperformance fairly robust across the range of thresholds.
In summary, evidence from simple tests support some belief that exiting or shorting the U.S. stock market when the monthly volatility risk premium is extremely low outperforms buy-and-hold.
Cautions regarding findings include:
- Using a rolling window rather than an inception-to-date average in the VRP strategies may work better. Optimizing rolling window length would impound snooping bias.
- As noted, the attractive performance of VRP timing depends materially on the unusual market conditions in 2008. To the extent performance depends on extreme events, the sample is very small.
- While not explicitly snooped, as shown, the selected VRP crash avoidance threshold may be lucky.