What drives the performance of risk parity asset allocation, and on what asset classes does it therefore work best? In their January 2014 paper entitled “Inter-Temporal Risk Parity: A Constant Volatility Framework for Equities and Other Asset Classes”, Romain Perchet, Raul Leote de Carvalho, Thomas Heckel and Pierre Moulin employ simulations and backtests to explore the conditions/asset classes for which a periodically rebalanced risk parity asset allocation enhances portfolio performance. Specifically, they examine contemporaneous interactions between risk parity performance and each of return-volatility relationship, return volatility clustering and fatness of return distribution tails (kurtosis). They then compare different ways of predicting volatility for risk parity implementation. Finally, they backtest volatility prediction/risk parity allocation effectiveness separately for stock, commodity, high-yield corporate bond, investment-grade corporate bond and government bond indexes (each versus the risk-free asset). They optimize volatility prediction model parameters annually based on an expanding window of historical data. They forecast volatility based on one-year rolling historical daily return data. Using daily total returns in U.S. dollars for the S&P 500 Index during 1980 through 2012 and for the Russell 1000, MSCI Emerging Market, S&P Commodities, U.S. High Yield Bond, U.S. Corporate Investment Grade Bond and U.S. 10-Year Government Bond indexes and the 3-month U.S. Dollar LIBOR rate (as the risk-free rate) during January 1988 through December 2012, they find that:
- Simulations indicate that:
- Return volatility clustering and return distribution fat tails are the major drivers of effectiveness for periodically rebalanced risk parity asset allocations. The effects of these drivers are stronger when there is a negative contemporaneous relationship between average return and volatility.
- If the Sharpe ratio is constant over time (positive relationship between return and volatility), a risk parity strategy is not effective.
- Based on historical data for the S&P 500 Index during 1980 through 2012, the I-GARCH model outperforms other regression models in predicting return volatility.
- Based on historical data for other indexes during 1988 through 2012 (see the charts below), a risk parity strategy is:
- Effective on a gross basis for stock and high yield corporate bond indexes, which exhibit volatility clustering and fat tails. Results are better for emerging than developed market stock indexes.
- Not effective for investment grade and government bond indexes, which exhibit little volatility clustering.
- Gross findings are robust to daily or weekly portfolio rebalancing, but longer rebalancing intervals erode risk parity benefits. Weekly rebalancing generates levels of turnover practical for implementation. Rebalancing only when volatility changes significantly (requiring daily monitoring) further reduces turnover.
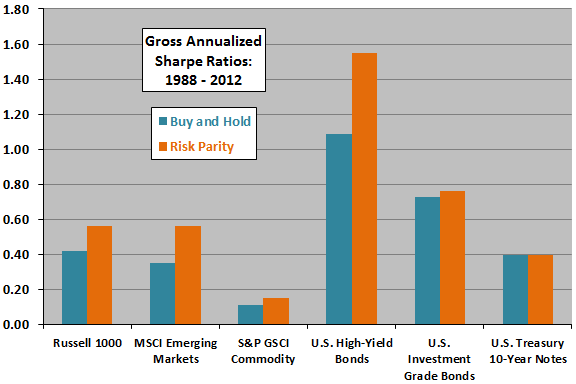
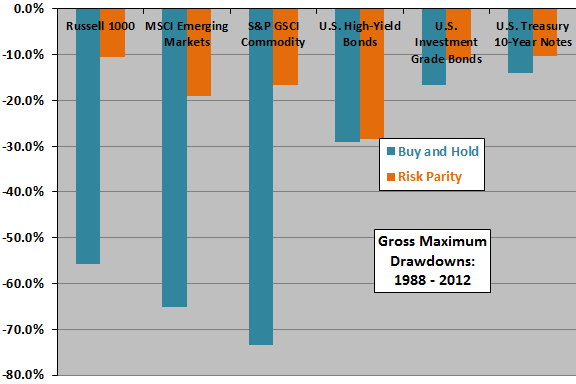
The following charts, constructed from data in the paper, compare gross annualized Sharpe ratios (upper chart) and gross maximum drawdowns (lower chart) for daily volatility predictions and daily rebalanced risk parity allocations separately for six asset indexes (each alone in a portfolio with the risk-free asset). Volatility predictions are from an I-GARCH model applied to the most recent year of data. Model parameters are optimized annually for an expanding window of historical data. Target volatility is 5%. Results indicate that this rigorous risk parity strategy:
- Effectively boosts Sharpe ratio for stock and high-yield bond indexes, but not for commodity, investment grade bond or government bond indexes.
- Effectively reduces maximum drawdown for stock and commodity indexes, but not for bond indexes.
In summary, evidence from simulations and backtests indicates that a rigorous risk parity strategy effectively manages risk for stocks, commodities and high-yield bonds, but not for investment grade or government bonds, due to differences in volatility clustering and return distribution kurtosis.
Cautions regarding findings include:
- Reported performance of the risk parity strategy is gross, not net, and the strategy generates substantial turnover that varies by asset class. For some investors, even weekly and closely monitored rebalancing may generate trading frictions that materially reduce strategy effectiveness.
- Use of indexes, which do not include the costs of creating and maintaining liquid funds for investment, may materially overstate expected performance.
- The sample period, one of secular disinflation especially favorable to bonds, may not be representative of future financial market conditions.