For which stocks does market-adjusted (idiosyncratic) volatility work as an indicator of future returns (see “No Reward for Risk?”)? In their January 2012 paper entitled “Dissecting the Idiosyncratic Volatility Anomaly”, Linda Chen, George Jiang, Danielle Xu and Tong Yao measure the idiosyncratic volatility premium in different subsamples of U.S. stocks. To measure the premium, they focus on differences in average monthly returns and four-factor (market, size, book-to-market, momentum) alphas between both value-weighted and equal-weighted top and bottom deciles of prior-month idiosyncratic volatility. They consider the following stock universe subsamples: (1) common stocks and non-common stocks; (2) microcap, small and big stocks (breakpoints at the 20th and 50th percentiles of NYSE stock capitalizations); (3) stocks priced above $10, between $5 and $10 and below $5; and, (4) January and non-January returns. Using daily returns for NYSE/AMEX/NASDAQ common and non-common stocks, and for a value-weighted market index, to calculate monthly idiosyncratic volatility during 1963 through 2010, they find that:
- Microcap (large) stocks and stocks with prices below $5 (above $10) exhibit the greatest (least) variation in idiosyncratic volatility. Low-priced microcaps therefore have the potential to dominate full-sample results.
- For the entire universe of stocks, the negative idiosyncratic volatility premium is prominent only for value weighting, driven by very low returns in the most volatile decile.
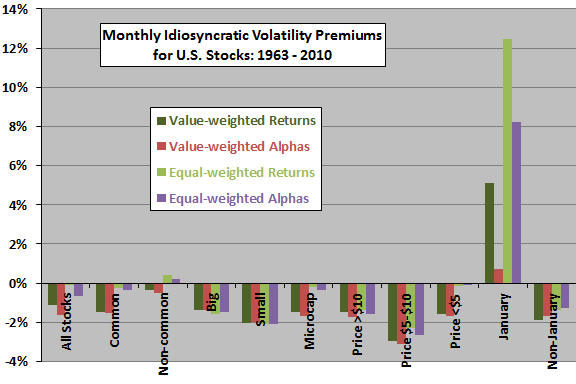
- With respect to different subsamples (see the chart below):
- The significant negative premium for value weighting derives only from common stocks.
- The negative premium is present among big and small stocks for both value and equal weighting, but among microcaps only for value weighting.
- Similarly, the negative premium is present among stocks priced above $10 and between $5 and $10 for both value and equal weighting, but among stocks priced below $5 only for value weighting.
- The negative premium derives from non-January months, during which it is significant for both value and equal weighting. During January, the premium reverses to a strong positive, driven mostly by smaller stocks.
- The idiosyncratic volatility premium does not derive from a short-term return reversal.
The following chart, constructed from data in the paper, summarizes the monthly idiosyncratic volatility premium for U.S. stocks over the entire sample period by value/equal weighting, return/alpha and stock subsamples. The premium in each case is the difference in average monthly returns or alphas between both the top and bottom deciles of prior-month idiosyncratic volatility. Results suggest that the premium concentrates in small, relatively low-priced stocks and that it reverses in January. Among all stocks and in several subsamples, the premium exists only for value weighting.

In summary, evidence indicates that the power of idiosyncratic volatility to predict future stock returns concentrates in common stocks that are not extremely small or extremely low-priced during months other than January.
Cautions regarding findings include:
- Reported returns are gross, not net. Reforming portfolios monthly likely generates substantial turnover and material trading frictions. Since small, low-priced stocks may have higher trading frictions than other stocks, implementation priority may differ from that suggested by the above findings.
- The statistical significance test used assumes tame distributions of returns. To the extent the actual return distributions are wild, the interpretation of this test breaks down.