A reader observed: “One of the problems with simple moving average (SMA) crossing rules is the churning from random price movements across the average. Lars Kestner proposes improvements to SMA crossing rules that signal:
- BUY when: (1) the close crosses over an SMA of the highs (rather than the closes); and, (2) the SMA of the closes is greater today than yesterday.
- SELL when the close crosses below an SMA of the lows (rather than the closes).
These rules create a self-adaptive band around the SMA to identify true trends rather then noise, while retaining most of the responsiveness of daily measurements.” Do these buffered SMA crossing rules outperform pure rules that simply buy (sell) on crossovers (crossunders) based on daily closes? To check, we compare the terminal values from pure and buffered rules for a 200-day SMA (SMA200) applied to both the Dow Jones Industrial Average (DJIA) and its exchange traded fund (ETF) proxy, SPDR Dow Jones Industrial Average (DIA). Using daily highs, lows and closes for DJIA since October 1928 and DIA since January 1998, both through early February 2014, and the contemporaneous 3-month Treasury bill yield as the return on cash, we find that:
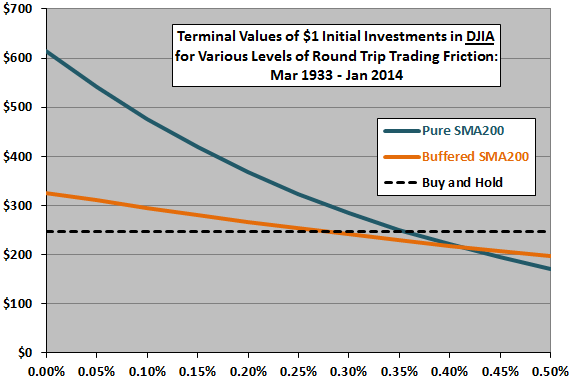
The following chart compares terminal values of $1 initial investments in DJIA using either pure or buffered SMA200 rules for a range of round-trip trading frictions. It also shows the terminal value for a buy-and-hold benchmark. Calculations assume:
- Start each series on 3/15/1933, the first date that both sets of SMA200 rules generate a buy signal.
- End the series on 2/3/2014 when both generate a sell signal.
- It is possible to anticipate signals slightly so that trades are at the close on signal dates (a problematic assumption in trading DJIA via its components over much of the sample period).
- When the buffered SMA200 rules generate consecutive buy or sell signals, use the first signal.
- Trading frictions are constant over the sample period (a problematic assumption for DJIA, since frictions vary considerably over the long sample period).
- The buy-and-hold benchmark bears no trading frictions (somewhat problematic due to changes in DJIA components over time).
- Return on cash is the contemporaneous T-bill yield.
The pure (buffered) SMA200 rules generate 259 (103) DJIA-cash round trip trades and are in stocks 68% (64%) of the time. Buffering thus dramatically suppresses trading while not greatly reducing exposure to DJIA. Results suggest that:
- Pure SMA200 rules outperform buffered rules for round trip trading frictions up to roughly 0.4% of portfolio value.
- Pure (buffered) SMA200 rules outperform the buy-and-hold benchmark for round trip trading frictions up to roughly 0.35% (0.30%) of portfolio value.
For a more realistic, but shorter, test we use the directly tradable DIA over its available history.
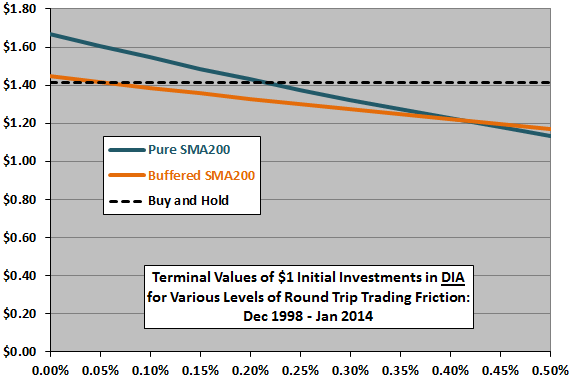
The next chart compares terminal values of $1 initial investments in DIA using either pure or buffered SMA200 rules for a range of round-trip trading frictions. It also shows the terminal value for a buy-and-hold benchmark. Assumption are the same as above, except:
- Start each series on 12/15/1998, the first date that both sets of SMA200 rules generate a buy signal.
- DIA return calculations use dividend-adjusted closes, implying frictionless reinvestment of dividends as accrued.
The pure (buffered) SMA200 rules generate 78 (43) round trip trades and are in stocks 66% (62%) of the time. Buffering thus dramatically suppresses trading while not greatly reducing exposure to DIA. Results suggest that:
- As for DJIA above, pure SMA200 rules outperform buffered rules for round trip trading frictions up to roughly 0.4% of portfolio value.
- Pure (buffered) SMA200 rules outperform the buy-and-hold benchmark for round trip trading frictions up to roughly 0.20% (0.05%) of portfolio value. On this basis, the buffered alternative is not attractive.
In summary, evidence does not support belief that buffered simple moving average crossing signals outperform unbuffered signals for investors bearing low trading frictions.
The above more generally illustrates the interplay among trading frequency, trading frictions and return on cash for simple market timing rules.
Cautions regarding findings include:
- SMA200 rule performance is generally sensitive to the proportion of bull and bear conditions in the sample, and thus to sample start and stop dates.
- As noted, some calculation assumptions are problematic (especially for the DJIA sample).
- Other metrics other than terminal value may be important to investors.
- Other SMA buffering rules may perform differently.
- The specified SMA buffering rules may perform differently for tradable assets other than DIA.