
Stocks with high historical volatility should produce high returns as reward for extra risk. Shouldn’t they? In the April 2007 version of their paper entitled “The Volatility Effect: Lower Risk without Lower Return”, David Blitz and Pim van Vliet examine the relationship between long-term (past three years) historical return volatility and risk-adjusted return for stocks worldwide. Ranking stocks based on historical volatility has some similarity to ranking them based on beta. Using monthly price and fundamental data for a large number of large-capitalization stocks over the period December 1985 through January 2006, they find that:
- The relationship between historical volatility and subsequent raw return is weak, except the most volatile tenth of stocks substantially underperforms.
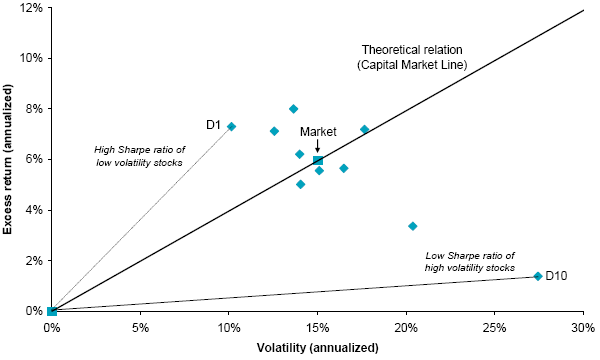
- On a risk-adjusted basis, the least volatile tenth of stocks worldwide outperforms the most volatile tenth by an average 12% annually during 1986-2006. Moreover, the least volatile tenth produces a Sharpe ratio of 0.72, much higher than the 0.40 Sharpe ratio of the overall world equity market.
- The outperformance of low volatility stocks relative to high volatility stocks in the U.S., European and Japanese stock markets individually is of comparable magnitude. The Sharpe ratio advantage for the least volatile tenth of stocks versus the overall market is 0.49 / 0.28 for Europe, 0.34 / 0.18 for Japan and 0.58 / 0.47 for the U.S.
- Low-volatility stocks generally underperform (outperform) the market during up (down) months, with the underperformance during up months considerably smaller than the outperformance during down months. High-volatility stocks exhibit the opposite behavior.
- The maximum drawdown for the least volatile tenth of stocks is 26%, compared to over 38% for the overall market and over 80% for the most volatile tenth of stocks.
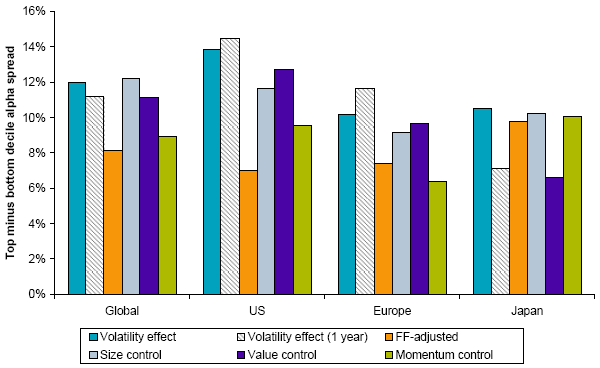
- The volatility effect is separate from, and comparable in magnitude to, the widely accepted size, value and momentum effects. On a risk-adjusted basis, the volatility effect ranks second to momentum out of the four. Only one third of the 12% low-minus-high volatility alpha noted above is attributable to the size and value effects.
- Ranking stocks on beta produces low-minus-high risk-adjusted return spreads that are less regular and 3%-7% smaller than those generated using historical volatility.
- The volatility effect is robust across subperiods and for different intervals of historical volatility.
- Possible explanations for the effect are: (1) leverage restrictions/inhibitions that limit exploitation; (2) investment manager incentives that focus on raw rather than risk-adjusted return; and, (3) a behavioral bias that bids up high-volatility “lottery tickets.”
The following figure, taken from the paper, shows how annualized excess return varies across ten portfolios of worldwide large capitalization stocks sorted/rebalanced monthly on long-term historical volatility over the period 1/86-1/06. It shows that Sharpe ratio falls steadily as portfolio volatility rises.
The next chart, also from the paper, shows both worldwide and regional average annual low-minus-high volatility alpha during 1/86-1/06, with and without controlling for traditional equity pricing factors. It also shows how using one-year historical volatility (rather than three-year) affects this alpha. The chart demonstrates that a sizeable alpha persists even after controlling for size, value and momentum separately and for the Fama-French (FF) factors collectively. The volatility effect therefore appears to be substantially independent of traditional pricing (and portfolio formation) factors.
In summary, investors overpay for volatile stocks over the long haul, most dramatically during bear markets.
The authors recommend that (long-term) investors hold low-volatility stocks in their portfolios as a distinct asset class to exploit the volatility effect.
Frequently Asked Questions
What is the volatility effect in stock investing?
The volatility effect is the finding that stocks with low historical return volatility deliver higher risk-adjusted returns than high-volatility stocks, contrary to the idea that more risk earns more reward. In the Blitz and van Vliet study of large-cap stocks worldwide (December 1985–January 2006), stocks were ranked on three-year historical volatility, and the weak relationship between volatility and raw return meant risk-adjusted returns favored low-volatility stocks.
Do low-volatility stocks outperform high-volatility stocks?
Low-volatility stocks outperformed high-volatility stocks on a risk-adjusted basis in this study, with the least volatile tenth of worldwide large-cap stocks beating the most volatile tenth by an average 12% annually during 1986–2006. The least volatile tenth earned a Sharpe ratio of 0.72 versus 0.40 for the world equity market, and the result was of comparable magnitude in the U.S., European and Japanese markets individually. The most volatile tenth substantially underperformed on a raw return basis.
How is the low-volatility effect tested using stock portfolios?
The low-volatility effect was tested by ranking large-capitalization stocks worldwide on their past three-year historical return volatility, sorting them into ten portfolios, and rebalancing monthly from December 1985 through January 2006. Risk-adjusted returns (alpha and Sharpe ratio) of the least volatile tenth were then compared with those of the most volatile tenth, with and without controlling for size, value, momentum and the Fama-French factors. Robustness was checked across subperiods and using one-year rather than three-year volatility intervals.
Is the low-volatility effect the same as the size, value and momentum effects?
The volatility effect is separate from, and comparable in magnitude to, the size, value and momentum effects, and on a risk-adjusted basis it ranks second to momentum among the four. Only about one third of the 12% low-minus-high volatility alpha is attributable to the size and value effects, and a sizeable alpha persists after controlling for the Fama-French factors. Ranking stocks on beta instead produced low-minus-high risk-adjusted spreads that were less regular and 3%–7% smaller than those from historical volatility.
Why might the low-volatility anomaly persist, and what are the caveats of exploiting it?
The low-volatility anomaly may persist because of leverage restrictions that limit exploitation, investment manager incentives focused on raw rather than risk-adjusted returns, and a behavioral bias that bids up high-volatility stocks as lottery tickets. These are possible explanations rather than proven causes. Low-volatility stocks also generally underperform the market in up months (by a smaller margin than their outperformance in down months), and the findings cover only large-cap stocks over December 1985–January 2006.