Does stock pairs trading work reliably in the mature UK market? In their November 2013 paper entitled “Pairs Trading in the UK Equity Market: Risk and Return”, David Bowen and Mark Hutchinson examine the profitability of pairs trading in this market via overlapping portfolios. Each month, they normalize prices for all stocks in the universe and select the five and 20 pairs of stocks with the lowest sums of squared daily normalized price differences over the past 12 months. They then trade these pairs over the next six months by buying (selling) the relatively undervalued (overvalued) stock in a pair when their normalized prices diverge by more than two standard deviations of daily price differences (from the 12-month pair selection interval). They close positions when normalized prices converge, or on the last day of the six-month trading interval. They include trading frictions derived from an estimate of the bid-ask spread, with a baseline friction of about 0.7% per round trip (open and close). Using daily prices for a broad sample of UK common stocks during January 1979 through December 2012, they find that:
- Over the entire sample period (see the chart below):
- Annualized total return of the FTSE All-Share Index is 10.9%, with annual standard deviation 16.1%.
- For the top five (20) pairs, an average 4.8 (18.7) pairs trade at least once, with average triggering price deviation of 1.9% (3.4%).
- The gross average annualized return for the top five (20) pairs is 7.4% (11.5%), and the net average annualized return is 6.2% ( 8.9%), with average annual standard deviation 5.0% (4.4%).
- For January 1980-October 1997 and November 1997-December 2012 subperiods:
- Annualized total return of the FTSE All-Share Index is much lower in the second subperiod.
- Pairs trade less frequently in the second subperiod than the first, but with wider price deviation triggers.
- The average net annualized return for the five-pair (20-pair) implementation is consistent: 6.4% (8.9%) in the first subperiod and 6.0% (9.1%) in the second.
- During 2007-2008, the FTSE All-Share Index falls 34%, while the top five (20) pairs gain an average 46% (36%). Similarly, in October 1987, pairs trading is highly profitable.
- Pairs trading portfolios typically have little exposure to market, size, value, momentum and reversal risk factors.
- Using different estimates of trading frictions based on effective spreads and quoted bid-ask spreads lowers average annualized pair trading returns up to 4% (more for the 20-pair than the five-pair implementation).
- Based on a limited test during 2007, high-frequency (hourly) pairs trading outperforms daily pairs trading for low levels of trading frictions.
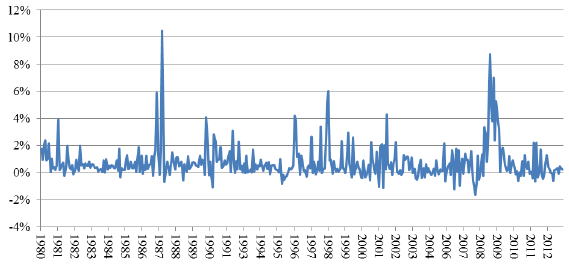
The following chart, taken from the paper, plots the net monthly returns for the top 20 pairs over the entire sample period. The strategy generates positive returns in 81% of months. The largest monthly return (10.5%) occurs in October 1987.
In summary, evidence indicates that pairs trading of UK stocks is consistently profitable over the past 32 years after accounting for frictions associated with the bid-ask spread (and especially profitable during crises).
Cautions regarding findings include:
- As noted in the paper: “In addition to bid ask spreads, investors will incur stamp duty, commission charges and charges for borrowing stock. Due to data unavailability we do not model these direct transaction costs but we caution the reader that incorporating these costs will lower returns.” It is possible that the stocks most costly to borrow generate the highest returns in the study.
- Feasibility of shorting (availability of shares to borrow) may also be an issue. It is possible that stocks not available for borrowing generate the highest returns in the study.
- The baseline method of accounting for bid-ask spread frictions does not allow for widening of the spread during liquidity crises.