Is there a more precise way to measure the premium available to investors willing to bear volatility risk than overall return variance? In their January 2015 paper entitled “Downside Variance Risk Premium”, Bruno Feunou, Mohammad Jahan-Parvar and Cedric Okou investigate the usefulness of (1) decomposing the variance risk premium (the difference between option-implied and realized variance) into upside and downside components and (2) defining the difference between these components as the skewness risk premium. They use high-frequency (5-minute) S&P 500 Index squared positive (negative) returns plus squared overnight positive (negative) returns to calculate realized upside (downside) variance. They sum upside and downside components to obtain total realized variance. They derive option-implied volatility from the most liquid out-of-the-money S&P 500 Index put and call options. Using intraday S&P 500 Index returns, daily S&P 500 Index option data and monthly yields for 3-month U.S. Treasury bills as the risk-free rate during September 1996 through December 2010, they find that:
- The downside variance risk premium comprises over 80% of the total variance risk premium and has a significantly positive relationship to the equity risk premium.
- The skewness risk premium has significant power to predict equity market excess (relative to the risk-free rate) returns, filling a gap in predictability between the short term (one to three months by the downside variance risk premium) and the long term (a year or more by valuation ratios).
- The skewness risk premium constructed from the last month (quarter) of data predicts stock market excess returns about eight to 12 (four to 12) months ahead.
- The skewness risk premium constructed from the past six or 12 months of data predicts stock market excess returns most strongly about nine months ahead.
- The total variance risk premium and the upside variance risk premium interact strongly with contemporaneous economic indicators, most notably total payroll in the private sector. The downside variance and skewness risk premiums interact much less strongly, suggesting they offer different information.
- In out-of-sample tests, downside variance and skewness risk premiums exhibit power to predict stock market excess returns equal to or better than those of total variance risk premium, price-dividend ratio and price-earnings ratio.
- Policy announcements that resolve financial/monetary uncertainty tend to reduce the magnitudes of all variance risk premium metrics.
- Results are robust to correction for a wide variety of common pricing factors.
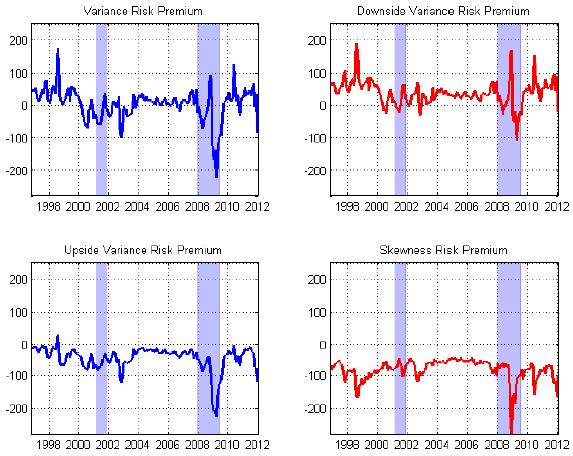
The following charts, taken from the paper, track U.S. equity market total variance risk premium, downside variance risk premium, upside variance risk premium and skewness risk premium over the available sample period. Shaded areas correspond to NBER economic contractions.
The downside variance risk premium is positive most of the time, while the upside variance risk premium is usually negative. Their combination, the total variance risk premium, is positive most of the time, reflecting the fact that investors are willing to pay more to hedge against bad uncertainty than to exploit good uncertainty. The skewness risk premium is consistently negative, suggesting that investors prefer higher skewness.
In summary, evidence suggests that downside variance and skewness risk premiums may be useful indicators of future stock market performance.
Cautions regarding findings include:
- The paper is esoteric and does not directly test any market timing strategies based on findings. Investors would likely have to retain an expert manager to perform the analyses, thereby bearing fees.
- Analyses are gross, not net. Accounting for frictions involved in executing any timing strategy based on findings would reduce effectiveness of predictive powers.
- Testing different past calculation intervals and forecast horizons introduces data snooping bias, such that the strongest findings tend to overstate effectiveness for new data. There may also be secondary snooping bias in methods/specifications borrowed from past research.
See also “Downside Beta Premium” for a more investor-oriented approach to measurement of downside risk at the stock level.