“Cross-asset Class Intrinsic Momentum” summarizes research finding that past country stock index (government bond index) returns relate positively (positively) to future country stock market index returns and negatively (positively) to future country government bond index returns. Is this finding useful for specifying a simple strategy using exchange-traded fund (ETF) proxies for the U.S. stock market and U.S. government bonds? To investigate we test the following five strategies:
- Buy and hold.
- TSMOM Long Only – Each month, hold the asset (cash) if its own 12-month past return is positive (negative).
- TSMOM Long or Short – Each month, hold (short) the asset if its own 12-month past return is positive (negative).
- XTSMOM Long Only – Each month hold stocks if 12-month past returns for stocks and government bonds are both positive, and otherwise hold cash. Each month hold bonds if 12-month past returns are negative for stocks and positive for government bonds, and otherwise hold cash.
- XTSMOM L-S-N (Long, Short or Neutral) – Each month hold (short) stocks if 12-month past returns for both are positive (negative), and otherwise hold cash. Each month hold (short) bonds if 12-month past returns are negative (positive) for stocks and positive (negative) for bonds, and otherwise hold cash.
We use SPDR S&P 500 (SPY) and iShares 7-10 Year Treasury Bond (IEF) as proxies for the U.S. stock market and U.S. government bonds. We use the 3-month U.S. Treasury bill (T-bill) yield as the return on cash. We apply the five strategies separately to SPY and IEF, and to an equally weighted, monthly rebalanced combination of the two for a total of 15 scenarios. Using monthly total returns for SPY and IEF and monthly T-bill yield during July 2002 (inception of IEF) through December 2016, we find that:
For all calculations, we: (1) ignore any trading frictions and shorting costs, and (2) assume SPY and IEF past 12-month returns can be accurately estimated just before the end of the lookback interval to allow execution of signals at the same close.
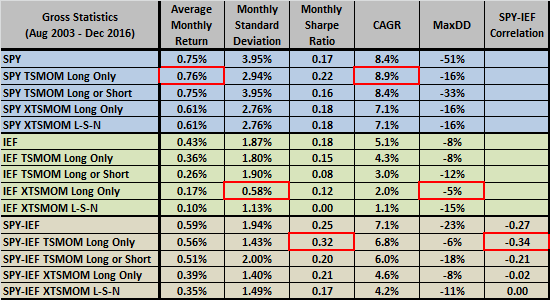
The following table summarizes six gross performance metrics for the 15 investment scenarios, with a red box around the best value for each metric. Monthly Sharpe ratio uses the monthly T-bill yield as the risk-free rate. CAGR is compound annual growth rate. MaxDD is maximum drawdown. SPY-IEF Correlation is the correlation of monthly returns between the SPY and IEF components of each SPY-IEF scenario. Results suggest that:
- The cross-asset class XTSMOM scenarios generally underperform conventional TSMOM counterparts.
- Shorting based on time series momentum is generally unhelpful.
- SPY TSMOM Long Only is attractive and is, in fact, similar to the widely used technical rule that holds a stock index (cash) when the index is above (below) its 10-month simple moving average.
- SPY-IEF attractively diversifies, and SPY-IEF TSMOM Long Only strengthens the diversification.
Potential implementation costs include:
- SPY-IEF-cash switching frictions for TSMOM and XTSMOM scenarios (as signaled).
- Shorting costs for Long or Short and L-S-N scenarios (as signaled).
- Rebalancing costs for all SPY-IEF scenarios (monthly).
- Tax implications of trading as applicable.
In summary, evidence from simple tests on available data do not support using the cross-asset class intrinsic momentum strategy for U.S. stock market and government bond ETFs.
Cautions regarding findings include:
- As noted, performance statistics are gross, not net. Implementation frictions would reduce performances of active/diversification scenarios.
- For simplicity, the above analyses do not equalize volatilities for different scenarios, as done in the referenced research. Equalizing volatilities would generally favor XTSMOM scenarios. However, applying leverage to XTSMOM portfolios would incur cost of leverage.
- Applying many strategy scenarios to the same data impounds model snooping bias, such that the best-performing scenario overstates expectations.
- Some lookback interval other than 12 months may work better, but experimenting with different intervals impounds additional snooping bias.