Does the variation of individual stock returns with liquidity support an investment style? In the January 2014 update of their paper entitled “Liquidity as an Investment Style”, Roger Ibbotson and Daniel Kim examine the viability and distinctiveness of a liquidity investment style and investigate the portfolio-level performance of liquidity in combination with size, value and momentum styles. They define liquidity as annual turnover, number of shares traded divided by number of shares outstanding. They hypothesize that stocks with relatively low (high) turnover tend to be near the bottom (top) of their ranges of expectation. Their liquidity style thus overweights (underweights) stocks with low (high) annual turnover. They define size, value and momentum based on market capitalization, earnings-to-price ratio (E/P) and past 12-month return, respectively. They reform test portfolios via annual sorts into four ranks (quartiles), with initial equal weights and one-year holding intervals. Using monthly data for the 3,500 U.S. stocks with the largest market capitalizations (re-selected each year) over the period 1971 through 2013, they find that:
- Annual independent sorts indicate that liquidity is about as effective as size, value and momentum in predicting future returns. Specifically, over the entire sample period:
- The gross geometric mean annual return for the quartile of stocks with the lowest (highest) liquidities is 15.4% (8.1%), with standard deviation of annual returns 20.4% (28.1%).
- Among top-performing quartiles, low liquidity has the second highest gross geometric mean annual return (high value is first at 16.9%).
- The intersections of liquidity sorts and sorts on the other three variables indicate that (see the charts below):
- The liquidity effect persists after controlling for size, but decreases as size increases. Within the quartile of stocks with the smallest (biggest) market capitalizations, low-liquidity stocks earn a geometric mean annual return of 16.3% (11.8%) compared to 1.5% (9.2%) for high-liquidity stocks.
- The liquidity effect is essentially independent of the value premium. Within the fourth of stocks with the highest (lowest) values, low-liquidity stocks earn a geometric mean annual return of 19.3% (10.8%) compared to 11.0% (3.3%) for high-liquidity stocks.
- The liquidity effect is largely independent of the momentum effect. Within the fourth of stocks with the highest (lowest) momentum, low-liquidity stocks earn a geometric mean annual return of 16.9% (11.3%) compared to 9.3% (4.0%) for high-liquidity stocks.
- Regressing monthly returns for a long-short liquidity portfolio versus a four-factor (market, size, book-to-market, momentum) model of stock returns indicates that the liquidity premium relates negatively to market returns and size, positively to value and slightly positively to momentum. Gross liquidity four-factor alpha is 0.35% per month.
- Liquidity is a relatively low-turnover style. On average, 63% of stocks remain in the same liquidity quartile from year to year (suggesting that annual liquidity portfolio turnover is higher than that for size, somewhat lower than that for value and much lower than that for momentum).
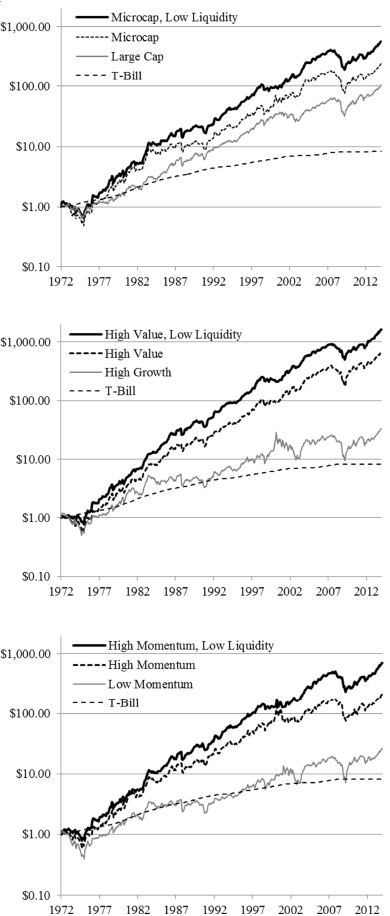
The following charts, taken from the paper, compare cumulative gross values of $1 initial investments in liquidity enhancements of size, value and momentum portfolios over the entire sample period. The combinations are the annually reformed:
- Intersection of the smallest (Microcap) quartile and the least liquid quartile (upper chart).
- Intersection of the highest value quartile and the least liquid quartile (middle chart).
- Intersection of the highest momentum quartile and the least liquid quartile (lower chart).
In all three cases, combination portfolios outperform size, value and momentum alone on a gross basis.
In summary, evidence indicates that low-liquidity stocks offer a reward to investors with long horizons and a willingness to trade infrequently.
Cautions regarding findings include:
- Reported returns are gross, not net. Incorporating reasonable trading frictions (which vary considerably over the sample period and at some times are very high) would depress results. Also, since bid-ask spreads relate positively to share turnover, trading frictions tend to be higher for illiquid stocks. The low (annual) portfolio reformation frequency mitigates this concern.
- Implementing a combination strategy may require considerable capital to establish enough positions to achieve outcome reliability (or a fee for delegation to a fund manager).
- Testing of multiple variables/combinations of variables on the same set of data introduces data snooping bias, such that the best performing variable/combination tends to overstate expectations.