
Most momentum investing strategies employ cross-sectional or relative strength by taking long (short) positions in assets exhibiting medium-term price strength (weakness). Is momentum also exploitable intrinsically, wherein an investor estimates momentum of an asset relative to its own medium-term history (time series)? In their August 2010 paper entitled “Time Series Momentum”, flagged by a reader, Tobias Moskowitz, Yao Hua Ooi and Lasse Pedersen investigate time series momentum in liquid futures contracts (typically nearest or next nearest) spanning nine equity indexes, 12 currency pairs, 24 commodities and 13 government bonds. They focus on a (12-1) test strategy that each month takes a one-month long (short) position in each contract series with a higher (lower) return than Treasury bills over past 12 months. When combining different contract series into a portfolio, they weight each position to make an equal expected contribution to portfolio volatility (divide by lagged standard deviation of returns). Using daily prices for these 58 futures, Treasury bills and relevant benchmark indexes from 1985 through 2009, along with contemporaneous weekly Commitments of Traders (COT) reports as available from CFTC, they find that:
- Past excess returns of each futures contract series relate positively to its own future return for all series, with persistence up to 12 months that partially reverses over longer horizons. Findings are robust across subsamples, past return measurement intervals and holding intervals.
- Over the entire sample period, a diversified portfolio of 12-1 time series momentum strategies across all inverse volatility-weighted contract series delivers substantial and stable abnormal returns with little exposure to standard risk factors. Specifically:
- The strategy generates a gross monthly alpha with respect to equities of about 1.26%, with insignificant dependence on market, size and book-to-market factors and positive dependence on a momentum factor.
- Adjusted for a broader set of risk factors encompassing multiple asset classes, the strategy generates a gross monthly alpha of about 0.94%.
- The strategy performs best during extreme markets and hence may serve as a hedge for extreme events.
- Time series momentum relates positively to traditional cross-sectional momentum, but still exhibits a gross monthly alpha of 0.66% relative to it.
- Both spot price momentum and the roll yield contribute to time series momentum of futures contracts, but only spot price changes drive long-term reversal.
- COT reports indicate that speculators profit from time series momentum at the expense of hedgers.
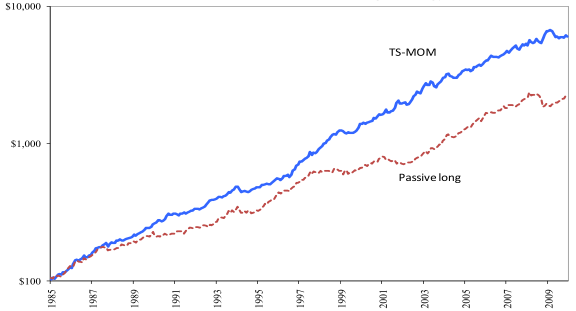
The following chart, taken from the paper, compares cumulative values of $100 initial investments at the beginning of 1985 in the diversified time series momentum (TS-MOM) strategy and a diversified Passive Long position in all futures contract series (both weighted inversely on past standard deviation of returns) over the entire sample period. The TS-MOM strategy provides a comparatively steady stream of positive returns and terminal wealth about three times higher than the passive counterpart.
In summary, evidence indicates that investors may be able to generate alpha by exploiting time series (intrinsic) momentum in futures contract series.
Cautions regarding findings include:
- Reported returns are apparently gross, not net. Including trading frictions for monthly portfolio formation would reduce returns depending on position sizes and specific broker fees. The number of positions in the diversified portfolio is large (58).
- Daily capital (margin) requirements for the strategy are dynamic and unpredictable. It is not clear how reported returns/alphas translate to return on necessary capital reserves.
- Since strategy performance depends partly on roll yield, time series momentum may not work as well for underlying (spot) indexes as for futures contract series.
Frequently Asked Questions
What is time series momentum in investing?
Time series momentum (also called intrinsic momentum) is a strategy that takes long or short positions in an asset based on its own past return relative to its own medium-term history, rather than relative to other assets. In the Moskowitz, Ooi and Pedersen study, an asset is held long if its past 12-month return exceeds the Treasury bill return and short if it is lower.
Does time series momentum generate alpha in futures markets?
Time series momentum generated substantial abnormal returns across 58 futures contracts from 1985 through 2009, with a gross monthly alpha of about 1.26% versus equities and about 0.94% after adjusting for a broader set of multi-asset-class risk factors. The strategy showed little exposure to standard risk factors and performed best in extreme markets. Reported returns are gross, not net of trading costs.
How is a 12-1 time series momentum strategy constructed and tested?
The 12-1 time series momentum strategy each month takes a one-month long (short) position in each futures contract whose past 12-month return is above (below) the Treasury bill return. Positions are weighted inversely to the lagged standard deviation of returns so each contributes equally to expected portfolio volatility. It was tested on daily prices for 58 liquid futures (nine equity indexes, 12 currency pairs, 24 commodities and 13 government bonds) from 1985 through 2009.
How does time series momentum differ from cross-sectional momentum?
Time series momentum differs from cross-sectional momentum in that it compares an asset to its own past performance, while cross-sectional momentum ranks assets against one another. The two are positively related, but time series momentum still produced a gross monthly alpha of about 0.66% relative to traditional cross-sectional momentum. Over 1985–2009, a diversified time series momentum portfolio also ended with terminal wealth about three times that of a passive long futures portfolio.
What are the limitations and risks of time series momentum strategies?
Time series momentum results are apparently gross of trading costs, so monthly rebalancing across 58 positions would reduce returns depending on position sizes and broker fees. Margin requirements are dynamic and unpredictable, and it is unclear how the alphas translate into returns on required capital reserves. Because performance depends partly on roll yield, the strategy may not work as well for underlying spot indexes as for futures contracts.