
Are momentum and trend-following strategies effective in tactical asset allocation to European equity sectors and countries? In the July 2013 version of their paper entitled “European Equity Investing Through the Financial Crisis: Can Risk Parity, Momentum or Trend Following Help to Reduce Tail Risk?”, Andrew Clare, James Seaton, Peter Smith and Steve Thomas apply momentum and trend-following strategies to portfolios of European sector and country indexes. Specifically, they consider three long-only sets of portfolios, as follows:
- Simple momentum: the equal-weighted top 8 or top 4 sectors or countries ranked by simple total return over the previous 1, 3, 6 or 12 months, or over the interval from 2 to 6 months ago, or the interval from 7 through 12 months ago.
- Risk-adjusted momentum: The inverse volatility-weighted top 8 or top 4 sectors and/or countries ranked over the same intervals by risk-adjusted returns (with both weighting and risk-adjusted returns based on daily returns over the past 120 days).
- Risk-adjusted momentum with SMA10: move positions in the risk-adjusted momentum portfolios to 3-month U.S. Treasury bills whenever the current value of the STOXX 600 Index is below its 10-month simple moving average (SMA10).
They ignore trading frictions involved in strategy implementations. Using monthly total returns in U.S. dollars for 19 European equity sector and 15 European country indexes during 1988 through 2011, they find that:
- Sector diversification generally outperforms country diversification, with or without use of a momentum strategy.
- Momentum strategies generally outperform equally weighted portfolios of sectors or countries. However:
- Momentum strategies still suffer maximum drawdowns in excess of 50%.
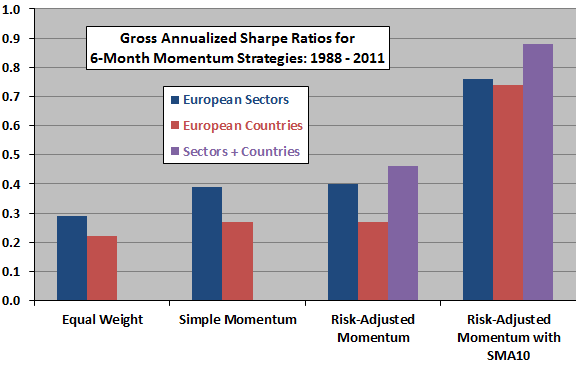
- Risk-adjusted momentum does not outperform simple momentum (see the chart below).
- Shorter ranking intervals generally work better than longer ones on a gross basis.
- Including an SMA10 overlay substantially improves the performance of the risk-adjusted momentum strategy by avoiding large drawdowns (suppressing tail risk). Overlays of simple moving average measurement intervals in the range 6-12 months produce similar results.
- Applying risk-adjusted momentum to a combined universe of sectors and countries, with or without an SMA10 overlay, moderately enhances performance.
The following chart, constructed from data in the paper, compares gross annualized Sharpe ratios for the 6-month momentum ranking interval from the alternative strategies outlined above. Results indicate that long-only momentum strategies add value and that the SMA10 crash protection overlay adds substantial value.
In summary, evidence from European sector and country indexes suggest that momentum and trend-following strategies materially enhance gross portfolio performance.
Cautions regarding findings include:
- The sample period is not long in terms of number of independent SMA10 measurement intervals or the number of longer momentum ranking intervals.
- As noted, reported returns are gross, not net. Including reasonable trading frictions would reduce these returns. Moreover:
- Portfolio turnover may be much higher for short momentum ranking intervals than long ones, such that the optimal interval based on net performance may differ from that based on gross performance.
- Expanding the number of assets considered (as when combining sectors and countries) increases momentum portfolio turnover and therefore trading frictions. In other words, there is a trade-off between number of assets considered and implementation costs.
- The study employs indexes rather than tradable assets, thereby ignoring the costs of maintaining liquid funds. Further, these costs may vary by sector and country, such that fund winners could differ from index winners.
See “Simple Sector ETF Momentum Strategy” and “Simple Sector ETF Momentum Strategy Robustness/Sensitivity Tests” for similar analyses of a U.S. equity sector momentum strategy, with and without an SMA10 overlay.