
A reader suggested a review of the investing expertise of Arch Crawford, editor and publisher of the Crawford Perspectives market timing newsletter. Arch Crawford has offered advice on financial markets based on technical analysis, sentiment indicators and planetary cycles since 1977, with a self-judgment that his “printed accuracy is Second to None!” His advice covers “the major stock indices, with some coverage of Gold, Oil, CRB Index, Bonds (Interest Rates) and the U.S. Dollar.” He offers no quantitative analysis of his trading results, but he makes publicly available an archive of 43 sequential issues of his newsletter spanning January 2002 through June 2005. In each issue is a “Vital Signs” feature that records and tracks recommendations to trade the S&P 500 Index and the Dow Jones Industrial Average. Using the 43 recommended S&P 500 Index trades and closing levels for the S&P 500 Index on the trade dates, we find that:
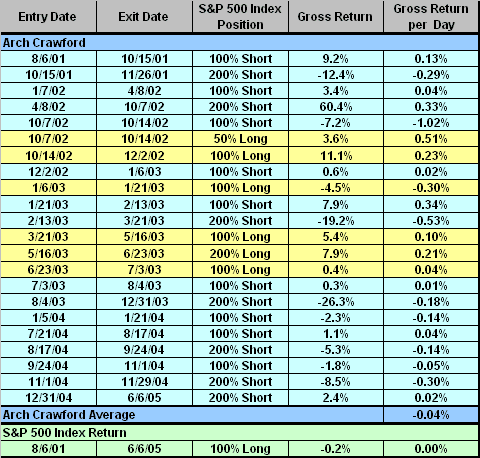
The following chart summarizes trade entry dates, exit dates, positions, gross returns and gross returns per calendar day invested for each of the trades recommended in the available archive. The final trade is open at the end of the archive and, for review purposes, the last return is based on the closing level of the S&P 500 Index on the date of the last issue in the archive. There are apparently two active positions during 10/7/02-10/14/02, one short and one long. Notable results are:
- Arch Crawford’s recommendations for trading the S&P 500 Index cover 1,146 out of 1,400 calendar days (82%) during the sample period.
- 13 out of 22 trades (59%) are profitable before transaction fees and shorting costs, but three of the positive gross returns are near zero. With trading frictions included, the net win rate is probably around 50%.
- Arch Crawford recommends using 200% leverage 48% of the time during the sample period, including three 200% short trades that generate gross returns of +60.4%, -19.2% and -26.3%. A portfolio based on such recommendations may be quite volatile.
- Arch Crawford’s average gross return per calendar day (with each of the 254 days days he is out of the market assigned 0.00%) is -0.04%. The average daily return for buying and holding the S&P 500 Index over the period of this test is 0.00%. Including return on cash while out of the market would increase Arch Crawford’s average daily return, while including trading frictions (and tax impacts, if any) would reduce it.
This sample of trades, though spanning nearly four years, is fairly small for inference about long-term performance.
As noted above, a portfolio driven by Arch Crawford’s recommended trades may be quite volatile, resulting in very positive or very negative short-term performance and therefore very high or very low annual rankings from such services as Hulbert Financial Digest and Timer Digest. His self-reported qualitative “track record” appears to be retrospectively assembled by the author and therefore may incorporate confirmation bias and non-representative sampling (cherry-picking of best trades and best short periods).
Here are additional notes to augment the limited trade sample:
From Peter Brimelow in MarketWatch (12/23/10): “The Terrible Ten for 2010… Crawford Perspectives, Arch Crawford: -12.4%… Still, it’s worth noting that, over the past three years — which include the Crash of 2008 — Crawford is up an annualized 5.12%, versus negative 4.26% annualized for the total return Wilshire 5000.”
From Peter Brimelow in MarketWatch (12/24/09): “Arch Crawford’s Crawford Perspectives (down 7.2% according to the Hulbert Financial Digest compared to a gain of 27.10% for the dividend-reinvested Wilshire 5000 Total Stock Market Index), was the top performing letter in 2008. …Crawford lost money this year…11th from the bottom… Crawford has had a checkered — but by no means catastrophic — career, and the letter probably should be credited with its strong medium-term record, up 6.95% annualized over three years against negative 5.73% annualized for the total return Wilshire 5000.”
From Peter Brimelow in MarketWatch (1/9/09): “Over the past 12 months through Dec. 31, Crawford Perspectives is up a remarkable 50.755% by Hulbert Financial Digest count [compared] with this year’s 37.2% loss for the dividend-reinvested Dow Jones Wilshire 5000. Over the past three years, the letter has achieved a 6.75% annualized gain, vs. an 8.4% annualized loss for the total return DJ-Wilshire 5000. Over the past five years, the letter has achieved an annualized 0.37% gain, vs. a 1.7% annualized loss for the total return DJ-W 5000. …over the past 10n years, Crawford Perspectives has achieved an annualized loss of 4.7% vs. a 0.6% annualized loss for the total return DJ-W. …over the entire 20 years that the HFD has followed it, it’s underperformed the market.”
From Peter Brimelow in MarketWatch (7/3/03): “Crawford has…negative 7.4 percent annualized over the past three years versus the market’s 9.7 percent loss…he made money (4.7 percent) over the past 12 months, whereas the market lost (7.2 percent). And, according to Mark Hulbert, Crawford’s market timing has also had streaks of success extending for periods of several years.”
In summary, evidence from simple tests on a limited dataset does not support a belief that Arch Crawford’s trading recommendations beat a buy-and-hold strategy.
See Guru Grades for a snapshot of the accuracies of various experts in forecasting the U.S. stock market, including links to evaluations of individual gurus.
Frequently Asked Questions
What is a market timing newsletter and how does it make trading recommendations?
A market timing newsletter is a publication that advises subscribers when to be long, short or out of the market rather than simply holding investments. Crawford Perspectives, edited by Arch Crawford since 1977, bases its advice on technical analysis, sentiment indicators and planetary cycles, covering mainly major stock indices with some coverage of gold, oil, bonds and the U.S. dollar.
Does Arch Crawford's Crawford Perspectives newsletter beat buy-and-hold?
Crawford Perspectives did not beat buy-and-hold in the simple tests on its S&P 500 recommendations. Across 43 newsletter issues from January 2002 through June 2005, Arch Crawford's average gross return was -0.04% per calendar day versus 0.00% for buying and holding the S&P 500 Index. The evidence from this limited dataset does not support a belief that his recommendations beat buy-and-hold.
How do you test the performance of a market timing newsletter's trade recommendations?
The performance of Crawford Perspectives was tested by extracting S&P 500 Index trade recommendations from the 'Vital Signs' feature of 43 archived issues (January 2002-June 2005) and using S&P 500 closing levels on trade dates to compute gross returns. Days out of the market were assigned 0.00%, and average gross return per calendar day was compared with buy-and-hold. The final open trade was valued at the close on the last issue's date.
How does a high trade win rate compare with actual market timing performance?
A high win rate does not guarantee outperformance, as Crawford Perspectives shows: 13 of 22 S&P 500 trades (59%) were profitable before fees and shorting costs, yet the average daily return of -0.04% trailed buy-and-hold at 0.00%. Three of the gains were near zero, and with trading frictions the net win rate is probably around 50%. Large losses on 200% leveraged trades, including short trades returning -19.2% and -26.3%, also affect results.
What are the limitations of evaluating a market timing newsletter like Crawford Perspectives?
The evaluation of Crawford Perspectives is limited by a small sample of 22 trades over nearly four years, which is fairly small for inferring long-term performance. The results exclude transaction fees, shorting costs, taxes and cash returns while out of the market. The newsletter's 200% leverage recommendations (48% of the time) can make a portfolio very volatile, producing very high or very low annual rankings, and its self-reported track record may reflect confirmation bias and cherry-picking.