Based on results from “Simple Sector ETF Momentum Strategy Performance”, “Does the Turn-of-the-Month Effect Work for Sectors?” and “Long-term SMA and TOTM Combination Strategy”, a subscriber proposed: “Have you ever thought of combining the three? When SPY is above a long term average, buy the best performing sector ETF using the TOTM strategy.” To investigate, we consider the nine sector exchange-traded funds (ETF) defined by the Select Sector Standard & Poor’s Depository Receipts (SPDR), all of which have trading data back to December 1998:
Materials Select Sector SPDR (XLB)
Energy Select Sector SPDR (XLE)
Financial Select Sector SPDR (XLF)
Industrial Select Sector SPDR (XLI)
Technology Select Sector SPDR (XLK)
Consumer Staples Select Sector SPDR (XLP)
Utilities Select Sector SPDR (XLU)
Health Care Select Sector SPDR (XLV)
Consumer Discretionary Select SPDR (XLY)
We determine sector momentum based on total return over the past six months (6-1). We define bull-bear stock market state according to whether SPDR S&P 500 (SPY) is above-below its 200-day simple moving average (SMA). We define the turn-of-the-month (TOTM) as the eight-trading day interval from the close five trading days before the first trading day of a month to the close on the fourth trading day of the month. Using daily dividend-adjusted closes for the sector ETFs and SPY from 12/22/98 through 8/10/12 (164 months), we find that:
The analyses below make the following assumptions:
- To allow calculation of 6-1 momentum, the first month of TOTM returns is July-to-August 1999.
- Trades occur at the close, with calculation of the 200-day SMA slightly anticipated such that trades coincide with crossing signals.
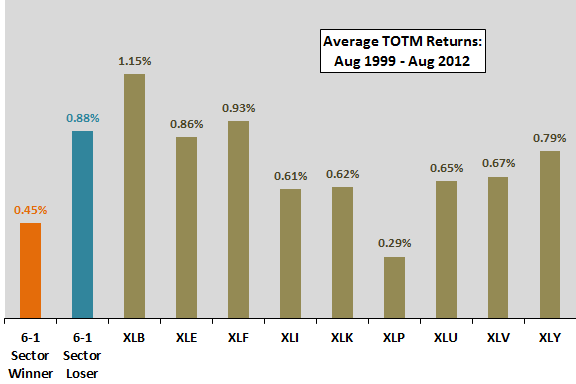
The following chart compares average TOTM returns for each sector ETF and for prior-month 6-1 momentum winner and loser sectors over the available sample. Notable results are:
- The return is higher for losers than winners (but the standard deviation of TOTM returns is higher for losers).
- The return for past winners is lower than those of all the sector ETFs except one.
- The standard deviation of TOTM returns (not shown) is substantially higher for past losers (4.83%) than for past winners (3.92%). In fact, TOTM return volatility is higher for past losers than for any of the individual ETFs.
Results suggest that TOTM is more likely connected to reversion (in a risky way) than momentum.

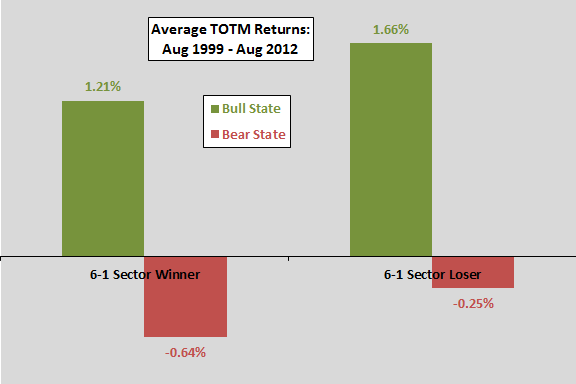
The next chart summarizes average TOTM returns for sector momentum winners and losers by bull and bear stock market states. The average TOTM returns for sector momentum losers are higher than those for winners in both states, with both loser and winner average returns higher in the bull state. In the bull (bear) state, the standard deviation of TOTM returns is notably higher (lower) for past winners than past losers.
Again, with TOTM amplification coming from losers, TOTM appears more connected to reversion than momentum.
A possible strategy would be to go with TOTM for sector momentum losers in a bull state and cash in a bear state.

In summary, limited evidence from simple tests suggests that the turn-of-the-month effect may be stronger for reversion rather than momentum conditions. In other words, momentum may rob future turn-of-the-month returns.
Cautions regarding findings include:
- The above analyses do not explicitly combine average return and volatility to construct cumulative trajectories.
- As strategies get more and more complex, snooping bias is elevated (due to optimization of strategy components).
- Shifting the sector ETF momentum calculation from end of the month (such that there is a nearly one-month delay from signal to next TOTM) to beginning of the TOTM interval may produce different results.