Does fourth quarter global economic data set the stage for asset class returns the next year? In their February 2015 paper entitled “The End-of-the-year Effect: Global Economic Growth and Expected Returns Around the World”, Stig Møller and Jesper Rangvid examine relationships between level of global economic growth and future asset class returns, focusing on growth at the end of the year. Their principle measure of global economic growth is the equally weighted average of quarterly OECD industrial production growth in 12 developed countries. They perform in-sample tests 30 countries and out-of-sample tests for these same 12 countries (for which more data are available). Out-of-sample tests: (1) generate initial parameters from 1970 through 1989 data for testing during 1990 through 2013 period; and, (2) insert a three-month delay between economic growth data and subsequent return calculations to account for publication lag. Using global industrial production growth as specified, annual total returns for 30 country, two regional and world stock indexes, currency spot and one-year forward exchange rates relative to the U.S. dollar, spot prices on 19 commodities, total annual returns for a global government bond index and a U.S. corporate bond index, and country inflation rates as available during 1970 through 2013, they find that:
- Global industrial production growth as specified averages 0.47% in the fourth quarter, with standard deviation 1.95%.
- Fourth quarter global industrial production growth exhibits a strong negative in-sample relationship with next-year returns for most asset markets/classes. Specifically:
- There is a statistically strong negative relationship between fourth quarter global industrial production growth and next-year real returns for 28 of 30 country stock markets (lower growth means higher future returns).
- A 1% higher fourth quarter global industrial production growth indicates a 3.1% lower next-year world equity market real return (see the chart below).
- Relatively strong fourth quarter global industrial production growth indicates relatively low next-year foreign exchange and commodity real returns.
- Relatively strong fourth quarter global industrial production growth indicates relatively low next-year real returns on U.S. corporate bonds, but industrial production growth is not a significant predictor of global government bond real returns.
- The average absolute error for out-of-sample annual stock market return forecasts based on fourth quarter global industrial production growth is smaller than average absolute errors for forecasts based on historical mean returns, global dividend-price ratio, short-term interest rate (U.S. Treasury bill yield) and U.S. consumption-wealth ratio.
- Fourth quarter global industrial production growth predicts returns even in countries with tax years and cultural years that do not end in December, and during economic expansions and contractions.
- In contrast, global industrial production growth rates for quarters one, two and three do not predict next-year asset returns.
- Fourth quarter global industrial production growth is generally a stronger predictor of next-year asset returns than is U.S. fourth quarter industrial production growth.
- Fourth quarter global industrial production growth predicts returns apparently because it anticipates shocks to discount rates (weak growth means lower rates), not cash flows.
- Fourth quarter global industrial production growth does not predict U.S. stock market volatility.
- The power of fourth quarter global growth to predict asset returns is robust to use of December-only rather than fourth quarter growth, to use of GDP rather than industrial production and across subsamples.
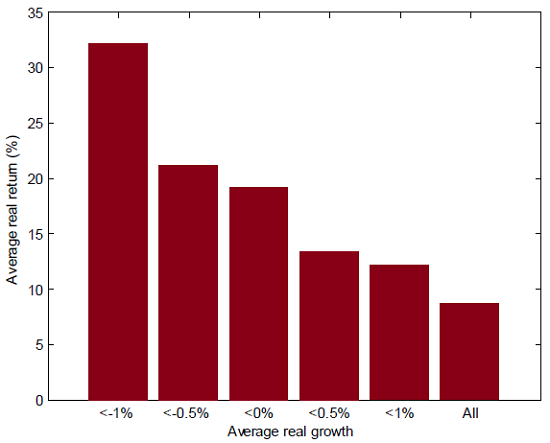
The following chart, taken from the paper, summarizes equally weighted average annual real stock index returns for 12 developed markets across different ranges of fourth quarter global industrial production growth during 1970 through 2013. The average annual real stock return (across countries and all years) is 8.6%, but real return is consistently higher for subsamples of progressively worse global growth during the preceding fourth quarter.
These findings are in-sample, meaning that an investor operating in real time would not know where to set a growth threshold. Results also do not account for any lag between the end of the fourth quarter and the availability of economic growth data for that quarter.
In summary, evidence indicates that investors may be able to use fourth quarter global economic growth data to time a wide range of asset classes.
Cautions regarding findings include:
- Reported returns are gross, not net. Any timing strategy would involve trades and trading frictions, thereby reducing these returns. However, trades would be relatively infrequent.
- Asset prices used to calculate returns are for indexes, not tradable assets. Incorporating the costs of creating and maintaining funds to track these indexes would reduce these returns.
- The basic in-sample analyses do not account for any lag in availability of end-of-year economic growth data. However, the study appendix shows that results are generally robust to incorporation of a one-quarter lag.
- Out-of-sample tests are academic and do not estimate level of profitability from using fourth quarter economic data to time asset markets.
- Spot commodity returns may not reflect returns accessible to investors.