A subscriber proposed: “It would be interesting to do an analysis of the Chemical Activity Barometer [CAB] to see if it has predictive value for the stock market. Either [look] at stock prices when [CAB makes] a two percent pivot down [from a preceding 6-month high] as a sell signal and one percent pivot up as a buy signal…[or when CAB falls] below its x month moving average.” The American Chemistry Council claims that CAB “determines turning points and likely future trends of the wider U.S. economy” and leads other commonly used economic indicators. To investigate its usefulness for U.S. stock market timing, we consider the two proposed strategies, plus two benchmarks, as follows:
- CAB SMAx Timing – hold stocks (the risk-free asset) when monthly CAB is above (below) its simple moving average (SMA). We consider SMA measurement intervals ranging from two months (SMA2) to 12 months (SMA12).
- CAB Pivot Timing – hold stocks (the risk-free asset) when monthly CAB most recently crosses 1% above (2% below) its maximum value over the preceding six months. We look at a few alternative pivot thresholds.
- Buy and Hold (B&H) – buy and hold the S&P Composite Index.
- Index SMA10 – hold stocks (the risk-free asset) when the S&P Composite Index is above (below) its 10-month SMA (SMA10), assuming signal execution the last month of the SMA measurement interval.
Since CAB data extends back to 1912, we use Robert Shiller’s S&P Composite Index to represent the U.S. stock market. For the risk-free rate, we use the 3-month U.S. Treasury bill (T-bill) yield since 1934. Prior to 1934, we use Shiller’s long interest rate minus 1.59% (the average 10-year term premium since 1934). We assume a constant 0.25% friction for switching between stocks and T-bills as signaled. We focus on number of switches, compound annual growth rate (CAGR) and maximum drawdown (MaxDD) as key performance metrics. Using monthly data for CAB, the S&P Composite Stock Index, estimated dividends for the stocks in this index (for calculation of total returns) and estimated long interest rate during January 1912 through December 2017 (about 106 years), and the monthly T-bill yield since January 1934, we find that:
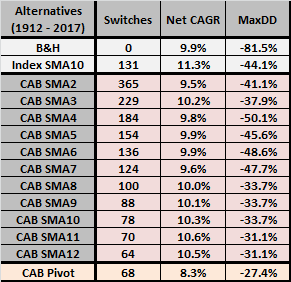
The following table compares numbers of asset switches, net CAGRs and MaxDDs for the above four strategies over the full sample period. Notable points are:
- Index SMA10 has the highest CAGR and a competitive MaxDD.
- CAB SMAx timing strategies are competitive with B&H based on CAGR and offer considerable downside protection (realized essentially during the early 1930s). CAB12 is near optimal among CAB SMAx variations.
- As SMAx measurement interval decreases (making timing more sensitive), net CAGR tends to decline (because of increasing switches) and MaxDD tends to deepen.
- CAB Pivot has the lowest CAGR, but also the shallowest MaxDD.
Times spent in stocks for Index SMA10, CAB SMA12 and CAB Pivot are 66.1%, 72.6% and 58.8%, respectively, suggesting that CAB Pivot may be too tightly specified. For example, relaxing the pivot “Buy” threshold to 0% boosts CAB Pivot CAGR to 9.7% with only a modest penalty to MaxDD.
Ignoring switching frictions has only small effects on CAGRs for Index SMA10, CAB SMA12 and CAB Pivot (adding 0.2% to 0.3%).
For additional perspective, we look at net cumulative performances.
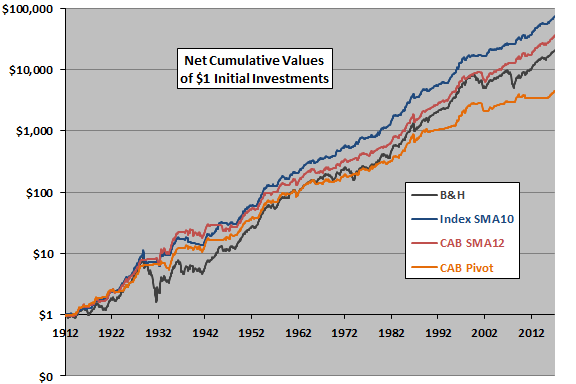
The following chart compares on a logarithmic scale net cumulative values of $1 initial investments in the four strategies computed with estimated total returns. Notable points are:
- As indicated above, Index SMA10 is the best overall performer, followed by CAB SMA10. CAB Pivot is competitive early in the sample period, but later lags substantially.
- CAB SMA12 underperforms B&H since 1938.
- The timing strategies largely avoid the deepest equity market crash of the early 1930s and the 2008-2009 equity market crash, but they do not avoid the 2000-2002 crash. Since 1950, MaxDD for CAB SMA12 is -31.1%, compared to -48.9% for B&H.
In summary, evidence from simple tests on available data offers little support for belief that CAB is a particularly useful U.S. stock market timing indicator.
Cautions regarding findings include:
- Input financial data are averages of monthly values, blurring monthly statistics. Using month-end data may affect results. For example, substituting month-end S&P 500 Index levels for S&P Composite Index values commencing January 1950 has little effect on CAB SMA12, but degrades both Index SMA10 (to CAGR 10.6%) and CAB Pivot (to CAGR 8.1%).
- The assumed constant level for costs of switching between stocks and T-bills is likely too low for much of the sample period and too high for recent years. While accounting for switching frictions, results ignore costs of maintaining a portfolio of stocks that track the S&P Composite Index. These costs may have been material for much of the sample period.
- Testing different timing strategies and different parameters within those strategies on the same sample introduces data snooping bias, such that the best-performing alternative overstates expectations.
- CAB data are generally available about a week before the end of the month measured. More timely application of this data might improve stock market timing with CAB.
- CAB construction for the early sample period may be largely retrospective with (snooped) specifications that optimize its ability to lead other economic variables.
- CAB data are as-revised. It appears that the American Chemistry Council routinely revises the last three months of data with each new CAB release, thereby incorporating look-ahead bias (for example, see “Use the U.S. LEI for Long-term Stock Market Timing?”). There may also be occasional recalibrations not evident in the available historical data.