A subscriber proposed adding an equity style momentum underlay to the Best Value version of the “Simple Asset Class ETF Value Strategy” (SACEVS). SACEVS each month allocates all capital to the one of the following asset class exchange-traded funds (ETF) corresponding to the most undervalued of the term, credit and equity risk premiums at prior month end, or to cash if no premium is undervalued:
3-month Treasury bills (Cash)
iShares 7-10 Year Treasury Bond (IEF)
iShares iBoxx $ Investment Grade Corporate Bond (LQD)
SPDR S&P 500 (SPY)
The proposed momentum underlay chooses SPY, iShares S&P 500 Value (IVE) or iShares S&P 500 Growth (IVW) based on highest five-month past return whenever the equity risk premium is most undervalued. Based on availability of inputs for month-end risk premium estimates, return calculations are based on closing prices for the first trading day of the next month. Using SACEVS premium estimate inputs since March 1989, first trading day of the month dividend-adjusted closes for SPY, IVE and IVW since IVE-IVW inception in May 2000 and first trading day of the month dividend-adjusted closes for IEF and LQD since their inception in July 2002, all through July 2016, we find that:
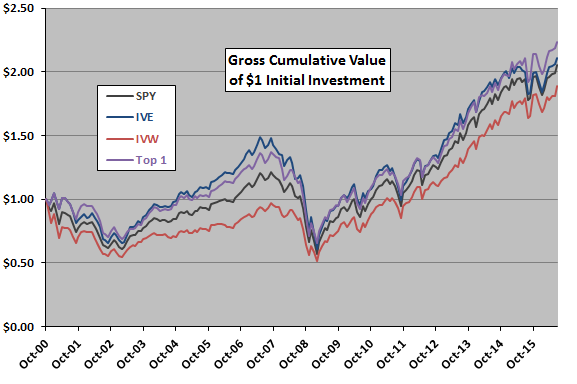
First, we test whether the equity style momentum underlay could add value. The following chart compares gross cumulative values of $1 initial investments in each of SPY, IVE, IVW and the momentum winner from among these three ETFs based on five-month past return (Top 1) over the available IVE-IVW history. The comparison starts in October 2000 to accommodate the initial momentum calculation.
In general, value (IVE) outperforms blend (SPY) and growth (IVW) over the available sample period. Top 1 performs similarly to IVE and has the highest terminal value. Top 1 has the highest average monthly return and the lowest standard deviation of monthly returns by slight margins. Compound annual growth rates (CAGR) for Top 1, IVE, SPY and IWW are 5.2%, 4.8%, 4.7% and 4.1%, respectively.
Top 1 involves 40 fund switches. Any frictions associated with these switches would reduce Top 1 performance.
Results suggest the equity style momentum underlay could add value. However, the sample period available for the SACEVS Best Value test commences July 2002. Are findings stable to a shift in start date from October 2000 to July 2002?
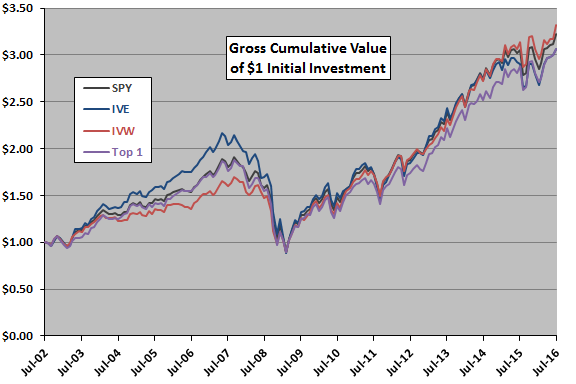
The next chart compares gross cumulative values of $1 initial investments in each of SPY, IVE, IVW and Top 1 since July 2002. This revised start date excludes most of the 2000-2002 bear market. For this sample, Top 1 has the lowest average monthly return and a middle-of-the-pack standard deviation of monthly returns. CAGRs for Top 1, IVE, SPY and IWW are 8.3%, 8.3%, 8.7% and 8.9%, respectively.
In this case, Top 1 involves 37 fund switches. Any frictions associated with these switches would reduce Top 1 performance.
Results suggest that the equity style momentum strategy is unreliable and using it as an underlay to SACEVS Best Value could hurt performance.
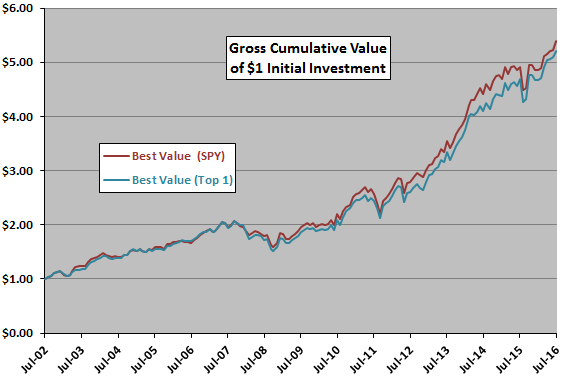
As a final test, we substitute Top 1 monthly returns for SPY returns in the SACEVS Best Value test.
The final chart compares gross cumulative values of $1 initial investments in SACEVS Best Value using either either SPY or Top 1 for equity exposure over the available sample period (14 years). Using Top 1 generates a slightly lower average monthly return and a slightly higher standard deviation of monthly returns. CAGRs when using SPY and Top 1 are 12.8% and 12.5%, respectively.
Using Top 1 in this test requires 45 fund switches, compared to just 20 for using SPY. Any switching frictions are to the disadvantage of Top 1.
In summary, evidence does not support belief that an equity style underlay improves the performance of SACEVS Best Value.
Cautions regarding findings include:
- As noted, reported performance data are gross, not net. Accounting for fund switching frictions would reduce performance of Top 1 and SACEVS (and may have tax implications).
- Relative equity style performance may interact with market/business cycles and therefore require very long sample for reliable comparison.
- Some other set of equity ETFs may provide a stronger momentum underlay. However, experimentation introduces snooping bias, such that the strongest results overstate expectations. Also, other ETFs may be fundamentally disconnected from the equity risk premium decision input.
See “Doing Momentum with Style (ETFs)” for a broader test of equity style momentum.