Failure rate, the conventional metric for evaluating retirement portfolios, does not distinguish between: (1) failures early versus late in retirement; or, (2) small and large surpluses (bequests). Is there a better way to evaluate retirement portfolios? In their December 2018 paper entitled “Toward Determining the Optimal Investment Strategy for Retirement”, Javier Estrada and Mark Kritzman propose coverage ratio, plus an asymmetric utility function that penalizes shortfalls more than it rewards surpluses, to evaluate retirement portfolios. They test this approach in 21 countries and the world overall. Coverage ratio is number of years of withdrawals supported by a portfolio during and after retirement, divided by retirement period. The utility function increases at decreasing rate (essentially logarithmic) as coverage ratio rises above one and decreases sharply (linearly with slope 10) as it falls below one. They focus on a 30-year retirement with 4% initial withdrawal rate and annual inflation-adjusted future withdrawals. The portfolio rebalances annually to target stocks and bonds allocations. They consider 11 target stocks-bonds allocations ranging from 100%-0% to 0%-100% in increments of 10%. When analyzing historical returns, the first (last) 30-year period is 1900-1929 (1985-2014), for a total of 86 (overlapping) periods. When using simulations, they draw 25,000 annual real returns for stocks and bonds from two uncorrelated normal distributions. For bonds, all simulation runs assume 2% average real annual return with 3% standard deviation. For stocks, simulation runs vary average real annual return and standard deviation for sensitivity analysis. Using historical annual real returns for stocks and bonds for 21 countries and the world overall during 1900 through 2014 from the Dimson-Marsh-Staunton database, they find that:
- From testing based on historical data (see the table below):
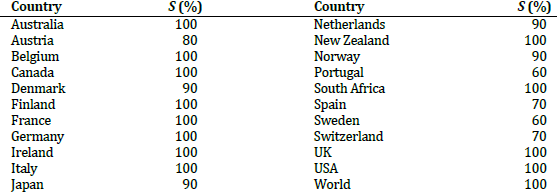
- For most countries, aggressive portfolios are optimal, with average allocation to stocks 91%. In over half the countries, including the U.S. and the world overall, the optimal allocation to stocks is 100%.
- Optimal allocations become more conservative as risk aversion and penalty for shortfall increase, but average allocation to stocks across countries never falls below 80%.
- Simulations confirm conventional wisdom that, all else equal, the optimal allocation to stocks:
- Increases with expected return on stocks.
- Decreases with expected volatility of returns for stocks.
- Increases with length of retirement.
The following table, taken from the paper, summarizes optimal allocations to stocks (S) for baseline risk aversion and shortfall penalty based on historical returns for stocks and bonds across 21 countries and the world overall. Assumptions are as outlined above.
In summary, analyses based on coverage ratio and an asymmetric utility function indicates that stocks-bonds retirement portfolios in most countries should tilt aggressively toward stocks.
Cautions regarding findings include:
- The data sample is very short in terms of independent 30-year periods (less than four), undermining confidence in findings based on historical analysis.
- Simulation assumptions greatly simplify how markets work, undermining confidence in findings based on simulation. For example, return distributions may not truly be normal, and returns for stocks and bonds may exhibit negative correlation.
- As argued in “Retirement Withdrawal Modeling with Actuarial Longevity and Stock Market Mean Reversion”, using actuarial longevity rather than fixed retirement periods is more realistic.
- Other refinements, such as changes in utility function with retiree age and market timing techniques, may affect findings.
For many other perspectives, see results of this search.