Does identification of trends in the CBOE Volatility Index (VIX) via simple moving averages (SMA) support effective timing of the U.S. stock market or VIX futures exchange-traded notes (ETN)? to investigate we consider timing four asset pairs:
- SPDR S&P 500 (SPY) – ProShares Short S&P500 (SH) since SH inception on 6/21/06.
- SPY – iShares 1-3 Year Treasury Bond (SHY) since 6/21/06.
- VelocityShares Daily Inverse VIX ST ETN (XIV) – iPath S&P 500 VIX ST Futures ETN (VXX) since XIV inception on 11/30/10.
- XIV – SHY since 11/30/10.
SPY and XIV are offensive assets, and SHY and VXX are defensive assets. We consider five individual SMAs to determine VIX trend: 200-day (SMA200); 100-day (SMA100); 50-day (SMA50); 20-day (SMA20); and, 10-day (SMA10). We also consider one “majority rules” combination wherein at least three of the five individual SMAs agree (SMA-Multi). When daily VIX is above (below) its SMA, expected stock market volatility is trending up (down), and we hold the defensive (offensive) asset of the above pairs. We assume a baseline 0.1% for asset switching frictions. Using daily values of the above assets as specified through most of September 2016 (10.3 years for SPY pairs and 5.8 years for XIV pairs), we find that:
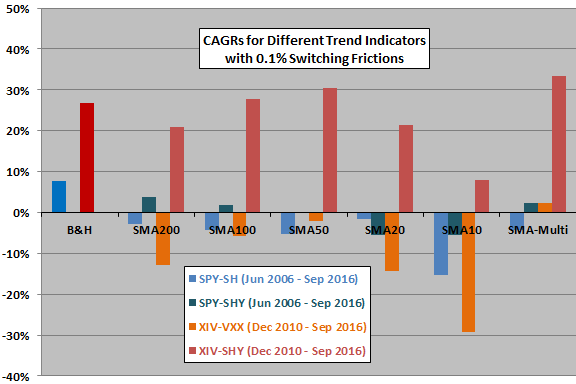
The following chart summarizes net compound annual growth rates (CAGR) based on a 252-day trading year and 0.1% switching frictions for all six trend signals and all four offensive-defensive asset pairs. The B&H CAGRs are for buying and holding SPY (blue, since June 2006) and XIV (red, since December 2010). Results indicate that:
- The signals do not work well for timing SPY-SH, SPY-SHY and XIV-VXX pairs.
- The signal may work for timing the XIV-SHY pair.
Since June 2006, the number of switches signaled by VIX SMAs range from 191 for SMA200 to 564 for SMA10. The number of switches for SMA-Multi is 323. Cumulative switching frictions are therefore material.
To dig deeper into the potential attractiveness of using VIX trends to time the XIV-SHY pair, we compare cumulative performances of XIV and XIV-SHY for SMA-Multi.
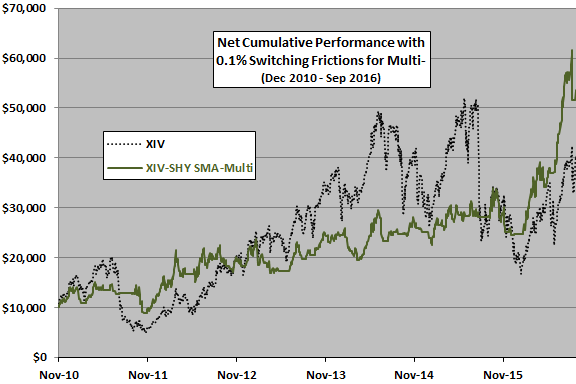
The next chart compares cumulative values of $10,000 initial investments in buying and holding XIV and in a strategy that switches between XIV and SHY based on the majority rules SMA-Multi timing rule (XIV-SHY SMA-Multi) since December 2010 with baseline 0.1% switching frictions. Results indicate that the timing rule suppresses downside volatility. Specifically:
- Net CAGRs for XIV and XIV-SHY SMA-Multi are 26.9% and 33.3%, respectively.
- Net average daily returns are 0.18% and 0.15% respectively, with standard deviations 4.12% and 2.57%. In other words, the timing strategy sheds volatility faster than it sheds average return.
- Maximum drawdowns are -74% and -41%, respectively. In other words, the timing strategy substantially suppresses maximum drawdown.
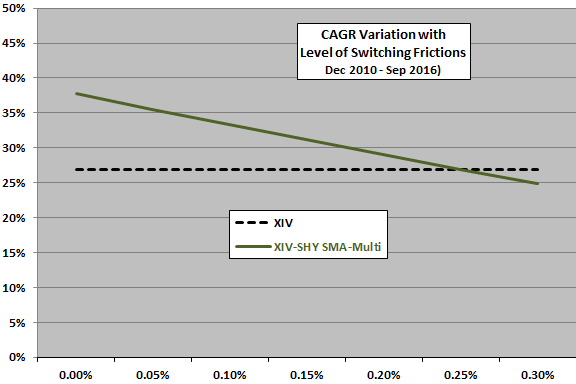
How sensitive is timing strategy performance to assumed level of trading frictions?
The final chart shows how XIV-SHY SMA-Multi strategy performance declines as the level of trading frictions increases from 0.00% to 0.30% since December 2010. There are 189 switches between XIV and SHY over the test period. Results indicate a 0.25% breakeven level for trading frictions.
In summary, evidence suggests that switching between XIV and SHY as offensive and defensive assets according to whether VIX is in a down or up trend as indicated by multiple SMA signals may be useful.
Cautions regarding findings include:
- Samples are not long in terms of variety of market conditions. The SPY pair sample includes the 2008-2009 financial crisis, but the XIV pair sample does not.
- Testing many strategy variations based on the same data or same signals introduces snooping bias, such that the best-performing variation overstates expectations. Using short samples exacerbates this effect.
See also “Use VIX Technical Signals to Trade Stock Indexes?”.