How should investors view the predictability of stock market returns and volatility? In sections 5 and 6 of the July 2012 version of his draft chapter entitled “Equity Market Level”, Andrew Ang examines the predictability of the equity risk premium and equity market volatility. He also addresses the exploitability of any predictive power found. Using both theoretical arguments and empirical tests based on long-run data through December 2011, he concludes that:
- Because of the variability of predictors, the level of equity risk premium predictability is theoretically low. Detecting and trading on this low predictability is difficult. Consistent with near-efficiency, a reasonable supposition is that less than 5% of stock market returns are predictable.
- Assertions of high predictability for long-horizon stock market returns generally derive from defective inference from overlapping measurement intervals, which inflate R-squared (sometimes grossly). Investors should be very suspicious of any claim that a variable exhibits high R-squared with respect to future stock market returns.
- Among 14 commonly cited stock market return predictors, only two exhibit statistically significant predictive power at horizons of one quarter to five years: ( 1) Shiller’s cyclically adjusted 10-year earnings yield (or the inverse price/earnings ratio); and, (2) deviations from long-run consumption-wealth trends (but this measure impounds look-ahead bias in its construction). Dividend yield has border-line predictive ability at a five-year horizon.
- Stock market volatility exhibits considerable predictability due to its persistence and reliable elevation after shocks.
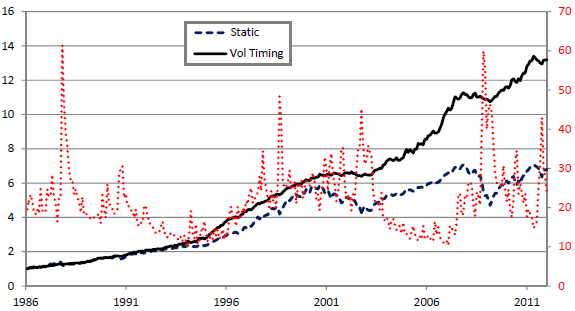
The following chart, taken from the paper, illustrates exploitability of volatility prediction by comparing gross cumulative returns (left-hand scale) from January 1986 to December 2011 for:
- A static portfolio (Static) allocating 60% to the U.S. stock market and 40% to U.S. Treasury bills (T-bill).
- A dynamic portfolio (Vol timing) that scales the stock market position inversely with the S&P 500 implied volatility index (VIX), shown in red using the right-hand scale.
The Vol timing portfolio largely avoids the drawdowns of the Static portfolio during the early 2000s and the 2008 financial crisis by shifting funds from stocks to T-bills. Vol timing equity weight ranges from near zero to 150%. The average annual return of the Static (Vol timing) portfolio is 7.9% (10.1%), and its reward-to-risk ratio is 0.82 (1.95).

In summary, investors should be very skeptical (less skeptical) about claims of stock market return (volatilty) predictability.
Cautions regarding findings include:
- See “P/E10 and Future Stock Market Returns” for simple, somewhat problematic, attempts to exploit Shiller’s cyclically adjusted 10-year earnings yield as a trading strategy.
- Returns for the volatility timing portfolio are gross, not net, including trading frictions and cost of leverage would lower the depicted cumulative return trajectory. The static 60%-40% portfolio would also incur trading frictions from periodic rebalancing. Moreover, the number of volatility regimes in the sample period is not large.
- Stock market volatility is not directly tradable. Volatility futures, which include investor anticipation of future volatility, likely exhibit less predictability than volatility itself. For example, see “Exploit Short-term VIX Reversion with VXX?”.