
Past research relating U.S. stock market returns to the party holding the Presidency mostly concludes that Democratic presidents are better for the stock market than Republican presidents. However, Presidents share power conferred by the electorate with Congress. Does historical data confirm that Democratic control of Congress is also better for stock market returns than Republican control of Congress? Is control of the smaller Senate more decisive than control of the House of Representatives? To check, we relate annual U.S. stock market (S&P 500 Index) returns to various combinations of party control of the Presidency, the Senate and the House of Representatives. Using party in power data and annual levels of the S&P 500 Index for December 1927 through December 2025 (98 years), we find that:
There are two years (1931-1932) for which the House of Representatives has equal numbers of Republicans and Democrats. We exclude House-related power combinations for those two years. We do assign recent Senates to the Democrats based on the Vice President’s tie-breaker vote.
The following chart summarizes average calendar year S&P 500 Index returns for various combinations of party in power over the full sample period. The number in parentheses after each combination is the number of years during which the combination holds. Some subsamples are extremely small. Results suggest that stocks do better when Democrats (Republicans) control the Presidency (House, Senate or both). Based on a very small subsample, Republican dominance is not propitious.
Using “election year” (November through October) returns rather than calendar year returns makes little difference.
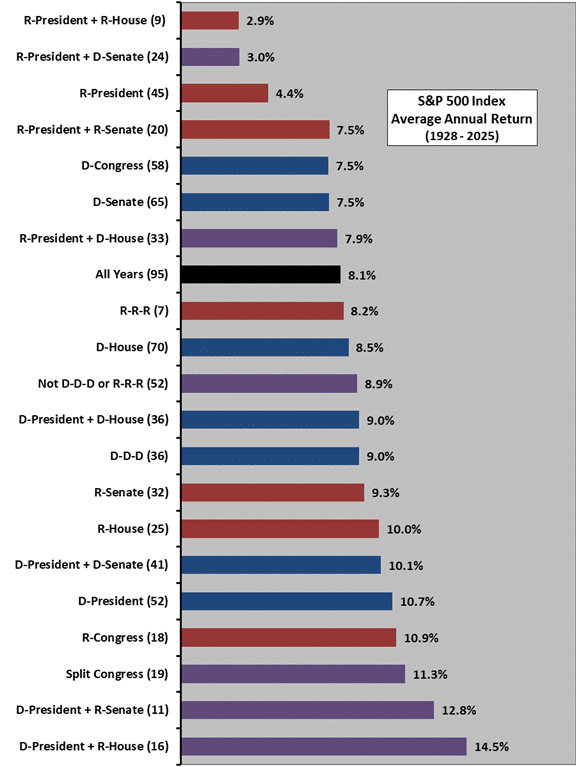
In summary, evidence suggests that divided government, with a Democrat as President and Republican control of part or all of Congress is the most favorable for U.S. stocks.
Cautions regarding findings include:
- As noted, subsamples are very small for reliable inference.
- The margins of power in the Senate and House of Representatives may be factors, but the small sample/subsample sizes argue against further stratification.
See also results of this search, and specifically:
- “Ziemba Party Holding Presidency Strategy Update”
- “Stock Market and the National Election Cycle”
- “Growing Political Effect?”
Frequently Asked Questions
What does divided government mean for U.S. politics and the stock market?
Divided government means the U.S. Presidency and at least part of Congress (the Senate or House of Representatives) are controlled by different political parties. In the S&P 500 analysis covering December 1927 through December 2025 (98 years), the divided combination of a Democratic President with Republican control of part or all of Congress is associated with the highest average calendar-year stock returns.
Do stocks perform better under Democratic or Republican control of the presidency and Congress?
Historical S&P 500 returns from December 1927 through December 2025 suggest stocks do better when Democrats hold the Presidency and Republicans hold the House, the Senate or both. Divided government with a Democratic President and Republican control of part or all of Congress shows the highest average calendar-year returns. Republican dominance of all three bodies is not propitious, but this rests on a very small subsample.
How do you measure stock market returns by party in power?
The analysis relates annual S&P 500 Index returns to combinations of party control of the Presidency, Senate and House of Representatives, using annual index levels from December 1927 through December 2025 (98 years). It averages calendar-year returns for each combination and counts the years each combination holds. Two years (1931-1932) with an evenly split House are excluded from House-related combinations, and recent Democratic Senates are assigned based on the Vice President's tie-breaking vote.
Does election-year return timing change results compared with calendar-year returns when analyzing party control?
Using election-year returns (November through October) instead of calendar-year returns makes little difference to the party-in-power findings. The conclusion that a Democratic President with Republican control of part or all of Congress is most favorable for U.S. stocks holds under either return window.
How reliable are stock return findings based on which party controls the White House and Congress?
The findings are descriptive rather than a trading test, and some party-combination subsamples are extremely small, which is too thin for reliable inference. The margins of power in the Senate and House may matter, but the small sample sizes argue against further stratification. The 98-year dataset (December 1927-December 2025) therefore supports only tentative conclusions.