In response to “OFR FSI as Stock Market Return Predictor”, a subscriber suggested overlaying a 10-month simple moving average (SMA10) technical indicator on the Office of Financial Research Financial Stress Index (OFR FSI) fundamental indicator for timing SPDR S&P 500 (SPY). The intent of the suggested overlay is to expand risk-on opportunities safely. To test the overlay, we add four strategies (4 through 7) to the prior three, each evaluated since January 2000 and since January 2009:
- SPY – buy and hold SPY.
- OFR FSI-Cash – hold SPY (cash as proxied by 3-month U.S. Treasury bills) when OFR FSI at the end of the prior month is negative or zero (positive).
- OFR-FSI-VFITX – hold SPY (Vanguard Intermediate-Term Treasury Fund Investor Shares, VFITX, as a more aggressive risk-off asset than cash) when OFR FSI at the end of the prior month is negative or zero (positive).
- SMA10-Cash – hold SPY (cash) when the S&P 500 Index is above (at or below) its SMA10 at the end of the prior month.
- SMA10-VFITX – hold SPY (VFITX) when the S&P 500 Index is above (at or below) its SMA10 at the end of the prior month.
- OFR-FSI-SMA10-Cash – hold SPY (cash) when either signal 2 or signal 4 specifies SPY. Otherwise, hold cash.
- OFR-FSI-SMA10-VFITX – hold SPY (cash) when either signal 3 or signal 5 specifies SPY. Otherwise, hold VFITX.
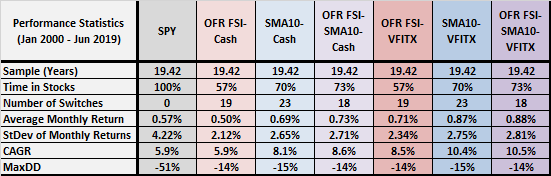
Using end-of-month values of OFR FSI, SPY total return and level of the S&P 500 Index during January 2000 (OFR FSI inception) through June 2019, we find that:
The following table summarizes sample duration, percentage of time in stocks (risk-on), number of switches, gross average monthly return, standard deviation of gross monthly returns, gross compound annual growth rate (CAGR) and maximum drawdown (MaxDD) for each of the above seven strategies over the full sample period. Notable points are:
- The sample period is lucky for SPY timing, because it starts near the beginning of the first of two severe equity bear markets in the sample.
- Timing SPY based on OFR FSI beats buy-and-hold by greatly suppressing volatility and MaxDD. When using VFITX as the risk-off asset, timing also substantially boosts CAGR.
- Timing SPY based on SMA10 mostly works better than that based on OFR FSI, though monthly volatility is higher for SMA10.
- Timing SPY based on both OFR FSI and SMA10 offers small improvements over timing based on SMA10 alone, with modestly higher exposures to equities over time but less trading.
- None of the timing strategies switch assets often, and numbers of switches are similar.
What about the recent subsample?
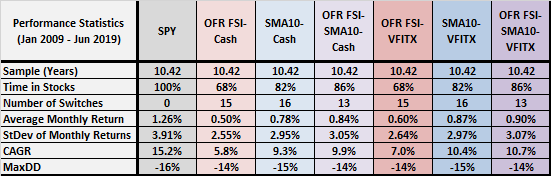
The second and final table summarizes the same statistics since January 2009. Notable points are:
- The sample period is unlucky for SPY timing, because it starts near the end of the second of two severe equity bear markets in the full sample.
- While suppressing monthly volatility, all timing strategies substantially underperform buy-and-hold.
- Again, timing SPY based on SMA10 mostly works better than that based on OFR FSI, though monthly volatility is still higher for SMA10.
- Again, timing SPY based on both OFR FSI and SMA10 offers small improvements over timing based on SMA10 alone, with modestly higher exposure to equities over time but less trading.
- Most of the of the asset switching in the previous table occurs during the recent subperiod.
In summary, evidence suggests that investors using an SMA10-like rule to manage equity risk may want to consider taking incremental equity risk by adding an OFR FSI signal, but associated performance improvements are small.
Cautions regarding findings include:
- Cautions in “OFR FSI as Stock Market Return Predictor” apply, including some instability in vintage OFR FSI data over time.
- In addition, testing many strategy variations on the same sample introduces data snooping bias, such that best results overstate expectations. Choosing a technical signal known to work for this sample risks inheriting additional snooping bias.