
Can investors improve retirement glide paths via judicious use of smart beta funds? In their March 2017 paper entitled “Life Cycle Investing and Smart Beta Strategies”, Bill Carson, Sara Shores and Nicholas Nefouse augment a conventional equities-bonds life cycle investing glide path with smart beta strategies. They use a conventional glide path, which gradually decreases the allocation to equities with age to a constant after retirement, to determine target risk levels over the life cycle. When the investor is young, they tilt equities toward the MSCI USA Diversified Multiple-Factor (DMF) Index to boost returns via value, size momentum and quality beta exposures. As the investor approaches retirement, they shift equities to the MSCI USA Minimum Volatility Index, designed to match the market return at lower risk. For bonds, they use the Barclays Constant Weights Index, which has greater diversification and higher Sharpe ratio than a conventional market capitalization-based bond index. They incorporate the specified smart beta indexes into the glide path via a procedure that maximizes Sharpe ratio while matching the risk of the conventional glide path. Specifically, they: (1) deviate no more than 3% from conventional glide path risk; (2) constrain smart beta equities beta relative to the Russell 1000 Index and the MSCI World Index ex U.S. to within 5% of the benchmark equities beta; (3) constrain smart beta bond index duration to within 0.05 years of the benchmark bonds duration; and, (4) require at least 1% allocation to bonds for all target date portfolios. Using monthly data for conventional capitalization-weighted U.S. equity and bond indexes and for the specified smart beta indexes during 2007 through 2016, they find that:
- During the 10 years through December 2016, annual gross returns and volatilities are:
- 7.0% and 15.3% for the MSCI USA capitalization-weighted market index.
- 8.2% and 15.9% for the MSCI USA DMF Index.
- 8.5% and 12.1% for the MSCI USA Minimum Volatility Index.
- 4.4% and 3.3% for the Barclays US Aggregate Bond Index (capitalization-weighted).
- 5.3% and 4.6% for the Barclays Constant Weights Index.
- The smart beta glide path as specified generally allocates more to equities than the conventional glide path (see the first chart below). For example, a 50-year old with retirement planned for 2030 on the smart beta (conventional) glide path has:
- Current equities allocation 80% (72%).
- Retirement equities allocation 46% (40%).
- Compared to a conventional glide path, the smart beta glide path boosts average annual gross return by roughly 1% and increases gross annual Sharpe ratio by 0.08 to 0.15 over the sample period. The size of the boost depends on retirement horizon (see the chart below). For example, the boost in gross annual Sharpe ratio is:
- In the range 0.19 to 0.27 for a 25-year old investor planning to retire in 2055.
- About 0.09 for a 50-year old investor planning to retire in 2030 (with less benefit from the boost in equities allocation).
The following charts, taken from the paper, compare allocations to equities (upper chart) and gross annual Sharpe ratios (lower chart) for the conventional and smart beta glide paths according to planned retirement year. The upper chart shows that smart beta has higher allocations to equities for nearly all horizons, including the retirement allocation but excepting the most distant retirement dates. The lower chart shows the boosts in gross annual Sharpe ratio for the smart beta glide path across planned retirement years.
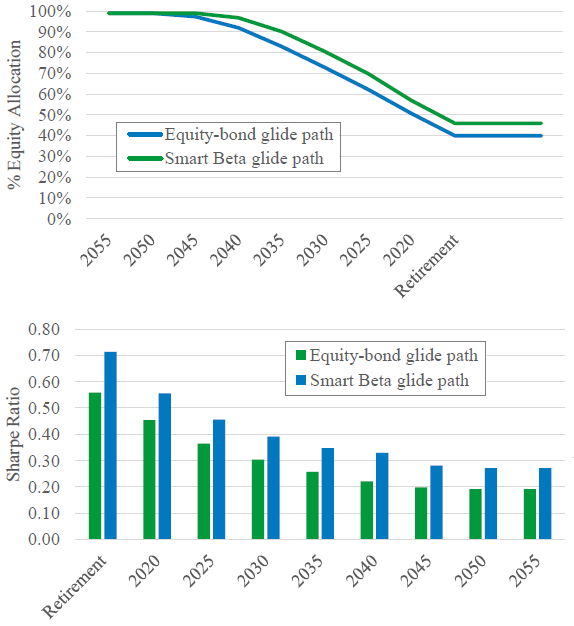
In summary, evidence suggests that a risk-matched smart beta glide path may improve Sharpe ratios by up to 20% over a conventional (capitalization-weighted) equities-bonds glide path.
Cautions regarding findings include:
- Use of indexes rather than tradable assets ignores the costs of maintaining liquid tracking funds, which may be substantial for smart beta strategies and may differ by type of beta. These costs would reduce returns and Sharpe ratios.
- Estimates also do not account for any costs of rebalancing to track specified glide path allocations.
- The launch months for the MSCI USA DMF Index, the MSCI USA Minimum Volatility Index and the Barclays Constant Weights Index are February 2015, June 2008 and April 2015, respectively. Analyses are largely, therefore, based on retrospective construction and are subject to model snooping bias, which may cause overstatement of smart beta performance expectations. Moreover, recent introduction of exchange-traded and mutual funds designed to exploit smart betas may suppress their premiums compared to past values.
- The smart beta allocation optimization procedure is beyond the reach of many investors, who would bear fees for delegating the procedure to an investment manager.
For other ideas about enhancing a conventional glide path, see:
- “Retirement Allocation Strategy Informed by P/E10”
- “Improving the Conventional Retirement Glidepath”
- “U-shaped Lifetime Allocation to Stocks?”
Frequently Asked Questions
What is a smart beta glide path in life cycle investing?
A smart beta glide path is a retirement target-date allocation that gradually reduces equity exposure with age but replaces conventional capitalization-weighted indexes with factor-based smart beta indexes. In the study, young investors tilt equities toward a multiple-factor index (value, size, momentum, quality), shift toward a minimum volatility equity index near retirement, and hold a constant-weights bond index.
Do smart beta strategies improve retirement glide path performance?
Smart beta strategies improved retirement glide path performance in a 2007-2016 retrospective test, raising average annual gross return by roughly 1% and gross annual Sharpe ratio by 0.08 to 0.15 versus a conventional glide path. The boost was larger for young investors (0.19 to 0.27 for a 25-year-old retiring in 2055) and smaller for those near retirement (about 0.09 for a 50-year-old retiring in 2030). The results are gross of costs and based on index data.
How do you build a risk-matched smart beta glide path?
The smart beta glide path is built by maximizing Sharpe ratio while matching the risk of a conventional equities-bonds glide path. Constraints keep risk within 3% of the conventional path, equity beta within 5% of benchmark equity beta versus the Russell 1000 and MSCI World ex U.S., bond duration within 0.05 years of the benchmark, and at least a 1% bond allocation in every target date portfolio. The inputs are monthly returns for smart beta equity and bond indexes during 2007 through 2016.
How does a smart beta glide path differ from a conventional target date glide path in equity allocation?
A smart beta glide path generally allocates more to equities than a conventional glide path for nearly all retirement horizons, except the most distant retirement dates. For example, a 50-year-old retiring in 2030 holds 80% equities on the smart beta path versus 72% on the conventional path, and 46% versus 40% at retirement. The higher equity allocation is possible because the smart beta indexes are used to match the conventional path's overall risk.
What are the limitations and risks of using smart beta in retirement glide paths?
The smart beta glide path results rely on indexes rather than tradable funds, so they ignore fund tracking and rebalancing costs that would reduce returns and Sharpe ratios. The key indexes launched only in 2008 (minimum volatility) and 2015 (multiple-factor and constant weights), so the analysis is largely retrospective and subject to model snooping bias that may overstate expected performance. Growing investment in smart beta funds may also suppress future premiums, and the optimization procedure is beyond many investors, who would pay fees for a manager to implement it.