Does the utilities sector exhibit a useful lead-lag relationship with the broad stock market? In their January 2014 paper entitled “An Intermarket Approach to Beta Rotation: The Strategy, Signal and Power of Utilities”, Charles Bilello and Michael Gayed test a simple strategy that holds either the U.S. utilities sector or the broad U.S. stock market based on their past relative strength. Specifically, when utilities are relatively stronger (weaker) than the market based on total return over the last four weeks, hold utilities (the market) the following week. They call this strategy the Beta Rotation Strategy (BRS) because it seeks to rotate into utilities (the market) when the investing environment favors low-beta (high-beta) stocks. They perform both an ideal (frictionless) long-term test and a short-term net performance test using exchange-traded funds (ETF). Using weekly total returns for the Fama-French utilities sector and broad market since July 1926 and for the Utilities Select Sector SPDR (XLU) and Vanguard Total Stock Market (VTI) since July 2001, all through July 2013, they find that:
- Since July 1926, recent outperformance of the utilities sector relates to future stock market volatility (including crashes) and market seasonality.
- Annualized stock market volatility is 18.1% (16.6%) when BRS is in utilities (the market). Since 1963, annualized stock market volatility is 18.0% (13.6%) when BRS is in utilities (the market).
- BRS is in utilities during 59% of the worst 2% of weeks (market declines greater than 5.5%).
- BRS is in utilities 51.5% (47.8%) during summer (winter) months.
- During July 1926 through July 2013, BRS generates a gross annualized total return of 13.9%, compared to 9.0% (9.8%) for buying and holding the utilities sector (the market).
- Outperformance is fairly consistent across long subperiods and decades. BRS beats the market on a gross basis during 82% of rolling three-year subperiods.
- BRS beats the market in all decades based on gross annualized return divided by annualized volatility.
- BRS outperforms the market on a gross basis during summer (by 1.3%) and winter (by 1.5%).
- However, executing switches between the utilities sector and the market would have been cumbersome and costly for most of the sample period. BRS underperforms the market on a net basis for switching friction higher than 0.37%.
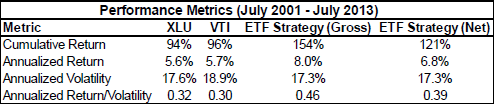
- BRS applied to XLU as a utilities sector proxy and VTI as a market proxy since July 2001, with switching friction 0.1%, outperforms both XLU and VTI (see the table below).
- BRS generates a total net return of 121%, compared to 94% for XLU and 96% for VTI.
- The ratio of net annualized return to annualized volatility is 0.39 for BRS, compared to 0.32 for XLU and 0.30 for VTI.
The following table, taken from the paper, summarizes gross and net performance of BRS as applied to total returns of XLU and VTI during July 2001 through July 2013. The assumed level of switching (selling one and buying the other) is 0.1%, encompassing broker fee, bid-ask spread and impact of trading). Over the 12-year sample period, BRS outperforms buying and holding one of the component ETFs by a little over 1% per year.
In summary, evidence suggests that investors bearing low trading frictions may be able to exploit short-term relative strength of the U.S. utilities sector and the broad U.S. stock market to switch between proxy ETFs.
Cautions regarding findings include:
- For long-term tests:
- The study essentially uses utilities sector and market indexes. This approach ignores costs of maintaining tradable, liquid funds (rebalancing costs, administrative fees, management fees).
- As noted, findings are not robust to reasonable costs of switching between utility and market indexes (see “Trading Frictions Over the Long Run”).
- The authors state that “…just because it may not have been possible to follow through on such a strategy in the past does not mean one should disregard the relative strength of Utilities and its predictive power.” A counter-argument is that, whenever a relationship becomes exploitable, the market adapts as competing investors discover and compete for the exploitability.
- The authors select a four-week return measurement interval to define relative strength based on prior research by others, potentially importing data snooping bias. Subperiod tests mitigate concern that this measurement interval is substantially lucky.
- For short-term tests, the assumed level of switching friction (0.1% two-way) is aggressive.
To explore these cautions, we conduct sensitivity tests through March 2014 on BRS using weekly dividend-adjusted closes for: (1) XLU and VTI since VTI inception in May 2001; and, (2) for XLU and SPDR S&P 500 (SPY) since XLU inception in December 1998. If the total return on XLU over a specified number of weeks is greater (less) than that of VTI or SPY, we hold XLU (VTI or SPY) the next week. Specific assumptions are:
- Baseline past return measurement interval is four weeks, as above, but we consider intervals from one to eight weeks. The common start date for all calculations accommodates the eight-week interval.
- We slightly anticipate the past return winner just before weekly closes, such that signals and trades occur at the same weekly closes.
- Initial investment is $10,000.
- Baseline ETF switching (two-way) friction is 0.1%, as above, but we consider switching frictions from 0.0% to 0.5%.
- Ignore tax implications of trading.
Note that the difference in XLU-VTI sample period (starting a few weeks later and extending through March 2014) may make robustness test results different from those reported in the paper.
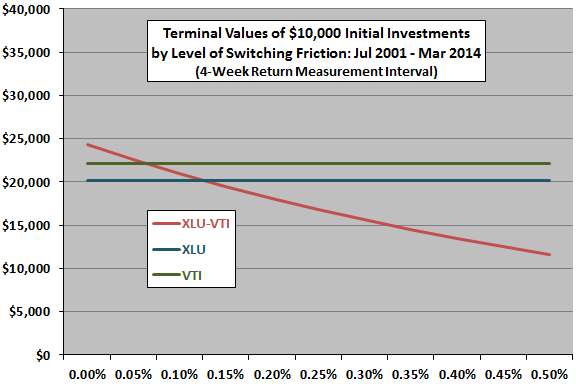
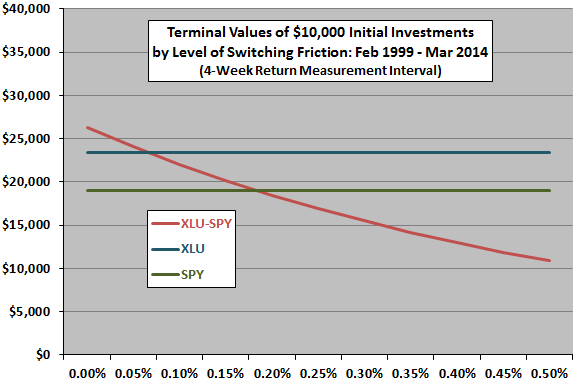
The following two charts summarize the effects of varying switching frictions on terminal values of $10,000 initial investments in BRS with baseline four-week past return measurement interval, as applied to an XLU-VTI pair (upper chart) and to an XLU-SPY pair (lower chart) over the respective available sample periods. In both cases, the past return measurement interval is four weeks. Results suggest that only investors who can achieve very low switching friction (and no tax penalty from trading) can exploit the strategy.
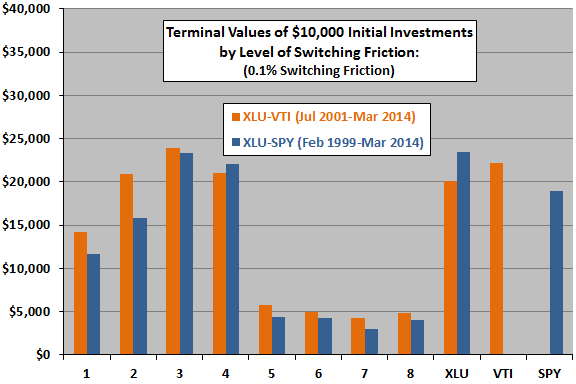
The next chart summarizes terminal values for BRS with baseline 0.1% switching friction, as applied separately to XLU-VTI and XLU-SPY pairs over available sample periods for past return measurement intervals ranging from one week (1) to eight weeks (8). It also shows terminal values for buying and holding XLU, VTI and SPY. Results suggest that a past return measurement interval in the range of three to four weeks is optimal, and that the interval must be near optimal to compete with buying and holding individual ETFs at the assumed level of switching friction.
Overall, results of robustness tests offer little room for exploiting the authors’ findings.
Comments from author Michael Gayed on the above are: “The main finding for us in terms of writing the paper really related more to the signaling power of Utilities in terms of volatility timing, and risk-adjusted return potential. For purposes of the competition the paper won the award in, the strategy part was meant to demonstrate consistency of a specific phenomenon across multiple sample periods. We ourselves use Utilities as an input in our models used for managing our mutual funds and separate accounts, but it is not the only one precisely to minimize potential trading switches and slippage/commission and confirm defensiveness.”