Can investors predict the return of a stock from its relationship with the dispersion of returns across all stocks? In their May 2017 paper entitled “Building Efficient Portfolios Sensitive to Market Volatility”, Wei Liu, James Kolari and Jianhua Huang examine a 2-factor model which predicts the return on a stock based on its sensitivity to (1) the value-weighted stock market return (beta risk) and (2) the standard deviation of value-weighted returns for all stocks (zeta risk). They first each month estimate zeta for each stock via regressions of daily data over the past year. They then rank stocks by zeta into quantile portfolios and calculate next-month equal-weighted returns across these portfolios and various long-short combinations of these portfolios (hedge portfolios) to measure dependence of future returns on zeta. Finally, they generate performance data for aggregate zeta risk portfolios by adding value-weighted market index returns to returns for each of the long-short zeta-sorted portfolios. Using daily and monthly returns for a broad sample of U.S. stocks in the top 90% of market capitalizations for that year, monthly equity market returns and monthly U.S. Treasury bill yields as the risk-free rate during January 1965 through December 2015, they find that:
- Over the sample period, average monthly stock market return is 0.89%, with standard deviation 4.49% and monthly Sharpe ratio 0.11. Average standard deviation of monthly value-weighted returns across all stocks is 8.29%.
- There is a strong positive relationship between zeta and next-month stock return. Specifically:
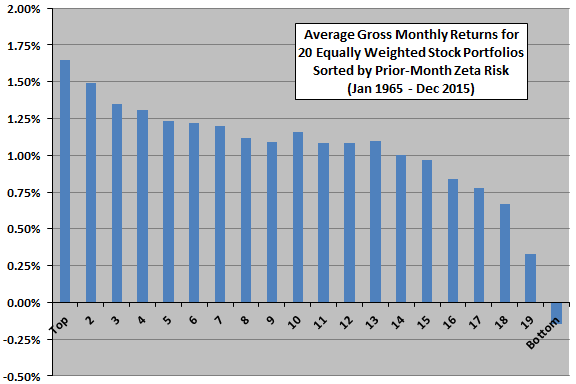
- Average gross monthly equal-weighted returns for stocks sorted into twentieths (ventiles) on prior-month zeta range from 1.65% for the ventile with the highest zetas to -0.15% for the ventile with lowest (see the chart below).
- An extreme hedge portfolio that is each month long (short) the equal-weighted 1% of stocks with the highest (lowest) prior-month zetas generates average gross monthly return 2.67%, with gross monthly Sharpe ratio 0.26.
- Zeta hedge portfolios outperform comparable size (small minus large), book-to-market ratio (high minus low) and momentum (winners minus losers) hedge portfolios. Comparisons suggest that hedge portfolios formed on size, book-to-market and momentum inefficiently extract market risk information related to zeta.
- For aggregate zeta-risk portfolios (combining the value-weighted market index with a zeta hedge portfolio):
- Setting the standard deviation of returns equal to that of the market index produces average gross monthly return 1.50% versus 0.89% for the index (annualized 19.6% versus 11.2%).
- Adding the extreme zeta hedge portfolio (top and bottom 1%) to the market index generates average gross monthly return 3.56% with gross monthly Sharpe ratio 0.36.
The following chart, constructed from data in the paper, summarizes average gross monthly returns for 20 equal-weighted ventile portfolios reformed monthly by sorting on prior-month zeta over the sample period. Stocks in high-zeta (low-zeta) portfolios have very positive (negative) zeta coefficients. Results indicate that:
- High-zeta stocks tend to outperform low-zeta stocks.
- The effect concentrates in the top and bottom few ventiles of the zeta distribution.

In summary, evidence indicates that stocks with returns that relate positively (negatively) to the lagged dispersion of all stock returns tend to outperform (underperform) the market.
Cautions regarding findings include:
- Reported performance metrics are gross, not net. Accounting for monthly portfolio reformation frictions would reduce these values. Extreme zeta stocks may be relatively illiquid, such that turnover is relatively more costly in extreme zeta portfolios.
- For long-short portfolios, shorting costs would further reduce profitability. Extreme zeta stocks may be relatively difficult to short.
- Data acquisition/processing requirements are substantial, beyond the reach of most investors. Delegating these processes to an investment manager would involve fees.
- Cross-sectional stock return factors based on U.S. data arguably involve aggregate/cumulative snooping bias as addressed in “Taming the Factor Zoo”, thereby overstating statistical significance. There may be specific snooping bias in the selection of one year of daily returns to measure zeta.
- Results are for U.S. stocks only.