Is there a way to enhance the ability of the cyclically-adjusted price-to-earnings ratio (P/E10 or CAPE) to predict U.S. stock market returns by incorporating real interest rates? In their June 2017 paper entitled “Improving U.S. Stock Return Forecasts: A ‘Fair-Value’ Cape Approach”, Joseph Davis, Roger Aliaga-Diaz, Harshdeep Ahluwalia and Ravi Tolani introduce “fair-value” CAPE that accounts for a dynamic, positive relationship between real 10-year U.S. Treasury note (T-note) yield (cost of capital) and real earnings yield (return on equity). They hypothesize that a lower real T-note yield should imply a lower earnings yield and thus a higher fair-value CAPE. Their use of fair-value CAPE to forecast stock market return involves:
- Each month, execute a multiple vector autoregression of the logarithms of the following five variables separately for each of the last 12 months: (1) inverse of CAPE; (2) expected real T-note yield based on a 10-year U.S. inflation forecast; (3) U.S. inflation; (4) realized S&P 500 Index price volatility over the last 12 months; and, (5) realized volatility of changes in real T-note yield over the last 12 months. Their 10-year inflation forecast is the average of 120 monthly forecasts generated via autoregression of the U.S. consumer price index over a 30-year rolling window.
- Each month, forecast 10-year stock market return (see the chart below) by summing: (1) percentage change in CAPE from the preceding vector autoregression; (2) constant earnings growth equal to its long-term average; and, (3) dividend yield calculated as earnings yield times the historical payout ratio.
They then compare out-of-sample forecasts of 10-year U.S. stock market returns for 1960 through 2016 and 1985 through 2016 generated by fair-value CAPE and two conventional CAPEs: Shiller CAPE based on Generally Accepted Accounting Principles (GAAP); and, Siegel CAPE based on National Income and Product Accounts (NIPA) earnings. Using Shiller’s data and NIPA earnings during 1950 through 2016, they find that:
- Since 1985, with 10-year U.S. stock market return forecast accuracy measured via root-mean-square error (RMSE):
- Shiller CAPE forecasts are far less accurate than the historical average return (RMSE 7.9% versus 6.2%), with its poor performance due to failure of CAPE to revert to a long-run average.
- Siegel CAPE forecasts are more accurate than those of Shiller CAPE, but are still inferior to the historical average return (RMSE 6.7% versus 6.2%).
- Fair-value CAPE U.S. stock market 10-year return forecasts are significantly more accurate than those of conventional CAPEs.
- Since 1960, fair-value CAPE forecasts based on GAAP earnings are substantially more accurate than those of Shiller CAPE (RMSE 3.3% versus 5.6%), and fair-value CAPE forecasts based on NIPA earnings are substantially more accurate than those of Siegel CAPE (RMSE 4.4% versus 5.0%).
- Since 1985 also, fair-value CAPE forecasts based on GAAP earnings are substantially more accurate than those of Shiller CAPE (RMSE 4.1% versus 7.9%), and fair-value CAPE forecasts based on NIPA earnings are substantially more accurate than those of Siegel CAPE (RMSE 3.5% versus 6.7%).
- Fair-value CAPE presently forecasts an historically low U.S. stock market annualized return of about 5.6% over the coming decade.
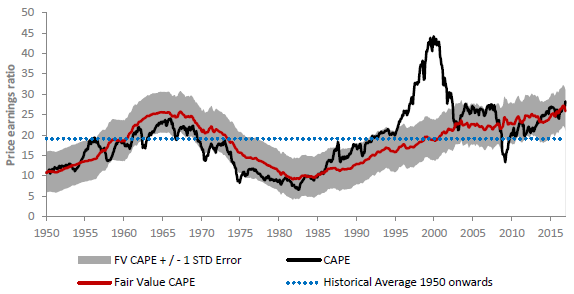
The following chart, taken from the paper, compares fair-value CAPE (red line) with Shiller CAPE (black line) since 1950. It also shows the sample average CAPE (dotted blue line). The gray band around fair-value CAPE shows a plus-or-minus one standard error range. Consideration of real T-note yield considerably moderates fair-value CAPE compared to Shiller CAPE.
In summary, evidence indicates that accounting for the relationship between real T-note yield and real earnings yield improves the accuracy of CAPE (P/E10) forecasts of 10-year future U.S. stock market returns.
Cautions regarding findings include:
- The fair-value CAPE model is complex and therefore susceptible to model snooping bias derived from experimentation with variable sets and parameter settings. In other words, complexity increases the ability of researchers to fit the Shiller dataset, thereby overstating applicability to future market conditions.
- The test periods (5.6 and 3.1 decades) are short in terms of independent 10-year earnings series and 10-year stock market return forecasts.
- The Shiller dataset incorporates look-ahead bias of several months regarding earnings inputs. This bias may be material during earnings crashes (as in 2008-2009), when the historical dataset “knows” about the earnings crash before the actual earnings releases.
- Execution of the fair-value CAPE model is beyond the reach of most investors, who would bear fees for delegating to an investment manager.
- 10-year return forecasts, which obscure intra-decade volatility, are of limited interest to investors and traders with performance horizons less than a decade.
- The study does not include any market timing strategies to test the assertion of the authors that the enhanced forecast accuracy of fair-value CAPE has economic value compared to reasonable investment benchmarks (for examples, see “Usefulness of P/E10 as Stock Market Return Predictor” and “Alternative Tests of P/E10 Usefulness”).
The fair-value CAPE model has similarities to the Fed Model and the Real Earnings Yield Model.