
Does the increase in number of Bitcoin wallets at a rate that far exceeds growth in number of Bitcoins explain the dramatic rise in Bitcoin price? In the December revision of his paper entitled “Metcalfe’s Law as a Model for Bitcoin’s Value”, Timothy Peterson models Bitcoin price according to Metcalfe’ Law, which posits that the value of a network (Bitcoin) is a function of the number of possible pair connections (among Bitcoin wallets, assuming all are equal) and is therefore proportional to the square of the number of participants. Said differently, he models Bitcoin value based on supply (number of Bitcoins) and demand (number of Bitcoin wallets). Per Metcalfe’s Law, Bitcoin return is proportional to twice the growth rate of Bitcoin wallets. He tests the model via a least squares regression of actual Bitcoin price on modeled price with adjustment for inflation due to new Bitcoin creation. He applies the model to investigate claims of Bitcoin price manipulation during 2013-2014. Using number of Bitcoins and number of Bitcoin wallets at 60-day intervals during December 31, 2011 through September 30, 2017, he finds that:
- Over the sample period, the number of Bitcoins more than doubles to over 16 million. As of 2017, Bitcoin hourly creation rate is about 60, and over 75% of all possible Bitcoins have been created.
- Average annual growth rate for Bitcoin wallets is about 84%.
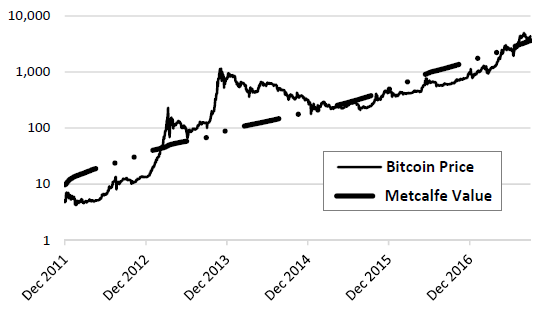
- Empirically, Metcalfe’s law explains Bitcoin price well over the full sample period, with R-squared statistic 0.78 (see the chart below). In other words, the model based on the law explains 78% of the variation in Bitcoin price.
- However, Metcalfe’s Law does not explain Bitcoin price during 2013-2014. Moreover, excluding 2013-2014 boosts the explanatory power of the model based on Metcalfe’s Law to 98%, reinforcing belief that someone manipulated Bitcoin price during 2013-2014.
The following chart, taken from the paper, tracks actual Bitcoin price and its value as modeled based on Metcalfe’s Law over the full sample period. Results indicate overall success for the prediction, but a notable mismatch during 2013-1014.
In summary, available evidence suggests that a simple model of Bitcoin price based on Metcalfe’s Law is useful for understanding and perhaps predicting Bitcoin price.
Cautions regarding findings include:
- The sample period is short, and the Bitcoin market is immature.
- As noted in the paper, modeling assumptions about Bitcoin activity and wallet use may be incorrect. Also, application of Metcalfe’s Law involves a “constant” of proportionality that may not be empirically constant.
- The study does not explore use of the model to trade Bitcoins.
Frequently Asked Questions
What is Metcalfe's Law and how does it apply to Bitcoin's value?
Metcalfe's Law holds that a network's value is proportional to the square of its number of participants, based on the number of possible pair connections among them. Applied to Bitcoin, it models price using supply (number of Bitcoins) and demand (number of Bitcoin wallets, assumed equal). Under this law, Bitcoin return is proportional to twice the growth rate of Bitcoin wallets.
Does Metcalfe's Law explain Bitcoin price movements?
Metcalfe's Law explains Bitcoin price well over December 2011 through September 2017, with an R-squared of 0.78, meaning the model accounts for 78% of price variation. It fails to explain price during 2013-2014, and excluding that period raises the R-squared to 0.98. The evidence suggests the model is useful for understanding and perhaps predicting Bitcoin price, though this is a theoretical model rather than a tested trading strategy.
How is a Metcalfe's Law model of Bitcoin price tested?
The Metcalfe's Law model of Bitcoin price is tested with a least squares regression of actual Bitcoin price on modeled price, adjusted for inflation from new Bitcoin creation. The inputs are the number of Bitcoins and the number of Bitcoin wallets, measured at 60-day intervals from December 31, 2011 through September 30, 2017. Over that period, wallets grew about 84% per year on average, while the Bitcoin supply more than doubled to over 16 million.
Does a poor fit with Metcalfe's Law mean Bitcoin price was manipulated?
A poor fit with Metcalfe's Law during 2013-2014 is consistent with claims of Bitcoin price manipulation in that period, but it does not prove them. The model failed to explain 2013-2014 prices, and removing those years lifted R-squared from 0.78 to 0.98, which reinforces belief that someone manipulated the price. The mismatch could also reflect flawed modeling assumptions about Bitcoin activity and wallet use.
What are the limitations of using Metcalfe's Law to model Bitcoin price?
Metcalfe's Law applied to Bitcoin has several limitations: the sample period (2011-2017) is short and the Bitcoin market is immature. Modeling assumptions about Bitcoin activity and wallet use may be incorrect, and the law's constant of proportionality may not be empirically constant. The study also does not explore using the model to trade Bitcoins.