Stock return anomaly studies based on firm accounting variables generally employ annually reformed portfolios that are long (short) the tenth of stocks expected to perform well (poorly). Does adding monthly portfolio updates based on technical stock price trend measurements boost anomaly portfolio performance? In the June 2015 version of their paper entitled “Anomalies Enhanced: The Use of Higher Frequency Information”, Yufeng Han, Dayong Huang and Guofu Zhou test eight equal-weighted long-short portfolios that combine annual screening based on a predictive accounting variable with monthly screening based on a simple moving average (SMA)-based stock price trend rule. The eight accounting variables (screened in June based on prior December data) are: (1) book-to-market ratio; (2) gross profitability; (3) operating profitability; (4) asset growth; (5) investment growth; (6) net stock issuance; (7) accruals; and, (8) net operating assets. The price trend screen excludes from the long (short) side of the portfolio any stock for which 50-day SMA is less than (greater than) 200-day SMA at the end of the prior month. Using accounting and daily price data for a broad sample of U.S. stocks during July 1965 through December 2013, they find that:
- Trend screen-enhanced anomaly portfolios generally have higher gross average returns and similar or lower volatilities than conventional anomaly portfolios (see the chart below). The equally weighted composite of all eight anomaly portfolios with (without) trend screens has:
- Gross average monthly return 1.47% (0.64%).
- Gross three-factor (market, size, book-to-market) monthly alpha 1.61% (0.60%).
- Gross five-factor (adding investment and profitability) monthly alpha 1.25% (0.39%).
- Enhancements from monthly trend screens come mostly from the short sides of anomaly portfolios, suggesting successful exclusion of rebounding stocks from short sides.
- Portfolio turnover is as high as 100% in June when updating accounting variable screens, but averages only about 15% in other months.
- Per three distinct illiquidity measures, alphas of conventional anomaly portfolios often concentrate in illiquid stocks, whereas those of trend screen-enhanced versions are about the same for liquid and illiquid stocks.
- Trend screen enhancement is greatest for stocks with the highest information uncertainty (idiosyncratic volatility).
- For both the conventional anomaly portfolios and the trend screen-enhanced versions, outperformance is reliable only during economic expansions.
- Alphas of conventional anomaly portfolios are significant only when investor sentiment is high, but those of trend screen-enhanced versions are evident regardless of investor sentiment (though stronger when sentiment is high).
- While other SMA measurement intervals work, 50-day and 200-day SMAs appear to be optimal.
- While value weighting of anomaly portfolios generally underperforms equal weighting, trend screen enhancement is still comparably strong.
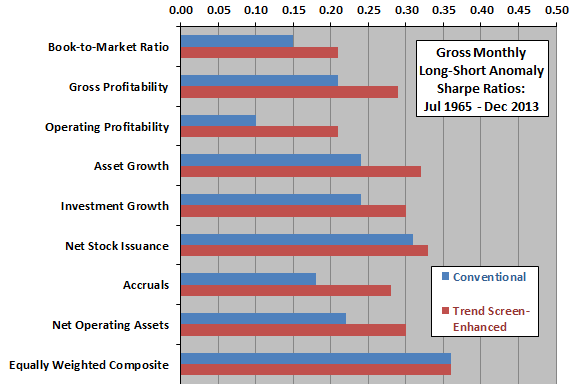
The following chart, constructed from data in the paper, summarizes how much monthly trend screening of conventional long-short anomaly portfolios enhances gross monthly Sharpe ratios. For each anomaly individually, adding the trend screen boosts gross Sharpe ratio. For the equally weighted composite of all anomalies, the trend screen does not improve gross Sharpe ratio because trend screening substantially increases volatility.
Since trend screening increases trading, improvements in net Sharpe ratios (if any) are smaller.
In summary, evidence indicates that adding a monthly stock price trend screen to an annual firm accounting variable anomaly screen generally boosts raw and risk-adjusted portfolio performance.
Cautions regarding findings include:
- As described, performance results are gross, not net. Accounting for trading frictions and shorting costs/constraints would lower returns for both conventional and enhanced anomaly portfolios. Performance hits would be greater for enhanced than conventional portfolios because the former have higher turnovers. The argument in the paper that low current trading frictions make findings exploitable ignores the likelihood that lower trading costs in the past would have altered market behaviors.
- As noted, trend screening enhancements are mostly in short sides of anomaly portfolios, inaccessible to long-only investors.
- The selected SMA parameters appear to impound snooping bias inherited from their popularity (exploratory testing by others on the same data), thereby overstating expectations.
- Monthly trend screening involves substantial data acquisition/processing burdens. Investors delegating these burdens to a fund manager would incur fees.
- Timely data collection and processing may not have been feasible early in the sample period. Even now, timing of data collection and execution related to trend screening appears problematic.