Do earnings surprises work differently for value and growth stocks? If so, can investors exploit the difference? In the September 2009 draft of their paper entitled “When Two Anomalies meet: Post-Earnings Announcement Drift and Value-Glamour Anomaly”, Zhipeng Yan and Yan Zhao investigate the combined effects of the value premium and the post-earnings announcement drift anomaly. They first sort stocks into quintiles according to some measure of value (book-to-market ratio, earnings-to-price ratio, cash-flow-to-price ratio or three-year average sales growth) and then allocate firms within these quintiles to six categories according to sign of the most recent quarterly earnings surprise (+/-/0) and the direction of the most recent earnings announcement abnormal return (+/-). Using stock price, earnings estimate and accounting data for a broad sample of firms over the period June 1984 through December 2008, they find that:
- Value stocks are less volatile than growth stocks around earnings announcement dates.
- Value stocks exhibit much larger positive drifts than growth stocks after positive earnings surprises and positive earnings announcement abnormal returns.
- Growth stocks exhibit much larger negative drifts than value stocks following negative earnings surprises and negative earnings announcement abnormal returns.
- A trading strategy that is long value stocks with both positive earnings surprises and positive earnings announcement abnormal returns and short growth stocks with both negative generates annualized size-adjusted returns of 16.6% to 18.8% (before trading frictions). Most of the return comes from the long side.
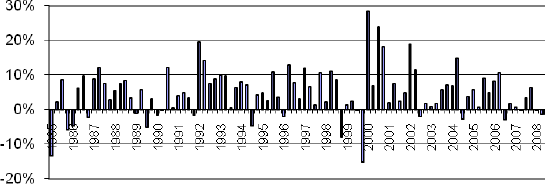
The following chart, taken from the paper, shows quarterly size-adjusted returns for a hedge strategy that is long value stocks (the fifth of stocks with the highest book-to-market ratios, equally weighted) which have positive earnings surprises and positive earnings announcement abnormal returns and short growth stocks (the fifth of stocks with the lowest book-to-market ratios, equally weighted) which have negative earnings surprises and negative earnings announcement abnormal returns. The annualized gross return is about 18.7%, with an annualized Sharpe ratio of 0.97. Nearly 80% of quarters produce a positive return. The correlation of these returns with contemporaneous quarterly S&P 500 Index returns is -0.06.
Similar portfolios that define value based on earnings-to-price ratio, cash-flow-to-price ratio and three-year average sales growth generate gross annualized returns of 17.9%, 18.8% and 16.6%, respectively.

In summary, evidence indicates that investors may be able to achieve abnormal returns by combining value and earnings surprises, with most of the benefit coming from value stocks with positive earnings surprises and positive earnings announcement abnormal returns.
Cautions regarding findings include:
- Returns are gross, not net. Accounting for trading frictions and shorting costs would reduce returns. Effects may be strongest among stocks that are most costly to trade (illiquid) and short (hard to borrow).
- Results at the portfolio level would involve capital management (cash reserves) to address a varying number of extreme earnings surprise opportunities over time.