Can investors apply forensic accounting principles (searching for inconsistencies, irregularities and other signs of trouble) to help forecast stock returns? In their July 2011 paper entitled “To Catch a Thief: Can Forensic Accounting Help Predict Stock Returns?”, Messod Beneish, Charles Lee and Craig Nichols investigate the ability of an earnings manipulation model to predict stock returns and detect fraud. The model, which relies exclusively on financial statement data, consists of eight ratios indicative of either financial statement distortions associated with earnings manipulation or a predisposition to engage in earnings manipulation. Specifically, four of the ratios detect unusual buildup in receivables, unusual expense capitalization and dependence of profits on accruals. The other four ratios detect deteriorating gross margins and increasing administration costs, high sales growth and increasing reliance on debt financing. The model calibration period is 1982-1988, and its initial test period is 1989-1992. Using the exact model published in the Financial Analyst Journal in 1999 as applied to accounting data and stock returns for a broad sample of NYSE, AMEX, and NASDAQ over the period 1993 through 2007 (33,848 firm-year observations, excluding financial services firms and small firms), they find that:
- The model flags 14.5% of all firms as potential profit manipulators. The original research suggests that, on average, manipulators tend to be smaller, less profitable, more levered and faster growing than peers.
- The model correctly identifies in advance 12 of the 17 highest profile 1998-2002 fraud cases.
- A hedge portfolio that is short (long) flagged stocks (other stocks), reformed monthly with apparently equal weights during 1993 through 2007, generates a gross annualized size-adjusted return of 9.7% (6.6 % from the short side and 3.1% from the long side). The portfolio is profitable at a gross level in 13 out of 15 years. In other words, “looking like a thief” indicates poor future performance.
- A multivariate regression of returns against market capitalization, book-to-market ratio, total accruals, return momentum, short interest level and probability of profit manipulation indicates that probability of manipulation is among the strongest of the associated six return anomalies.
- Augmenting decile sorts of the other five indicators with probability of manipulation greatly improves hedge returns (see the chart below). A hedge portfolio that is :
- Long (short) the tenth of firms with the smallest (largest) market capitalization generates a gross annualized size-adjusted return of 5.0%. Limiting the long (short) side to non-flagged (flagged) firms boosts this return to 14.8%.
- Long (short) the tenth of firms with the highest (lowest) book-to-market ratio generates a gross annualized size-adjusted return of 8.7%. Limiting the long (short) side to non-flagged (flagged) firms boosts this return to 15.4%.
- Long (short) the tenth of firms with the highest (lowest) return momentum generates a gross annualized size-adjusted return of 9.2%. Limiting the long (short) side to non-flagged (flagged) firms boosts this return to 23.5%.
- Long (short) the tenth of firms with the lowest (highest) short interest ratio generates a gross annualized size-adjusted return of 6.1%. Limiting the long (short) side to non-flagged (flagged) firms boosts this return to 15.3%.
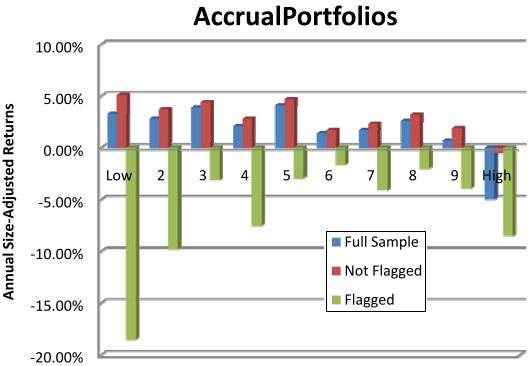
- Long (short) the tenth of firms with the lowest (highest) accruals generates a gross annualized size-adjusted return of 8.3%. Limiting the long (short) side to non-flagged (flagged) firms boosts this return to 13.3%.
- An ability to separate firms with accruals that are more likely to persist from those with accruals that are more likely to reverse drives model effectiveness. The model is particularly effective in predicting returns among low-accruals firms (firms with superficially high earnings quality).
The following chart, taken from the paper, illustrates the enhancement of the accruals effect from including probability of manipulation flags. A hedge strategy that is long (short) the tenth of firms with the lowest (highest) accruals generates a gross annualized size-adjusted return of 8.3%. Limiting the long (short) side to non-flagged (flagged) firms boosts this return to 13.3%.
Exploiting flagged firms with low accruals may be especially attractive.
The paper presents similar charts for forensic enhancement of the size effect, value premium, momentum and short interest effect.
In summary, evidence indicates that investors may be able to improve their stock picking materially by applying forensic accounting principles to identify firms that are potential profit manipulators.
Cautions regarding findings include:
- Return calculations are gross, not net. Accounting for reasonable trading frictions would materially reduce profitability of hypothethical trading strategies. Profitability may well be concentrated in stocks that are most costly to trade.
- As noted, the study excludes financial services firms and very small firms and may not work for them.