Do investors fixate on price-to-earnings ratio (P/E) and thereby create trading opportunities as P/Es change? In his June 2017 paper entitled “P/E Ratios and Value Investor Attention”, Jordan Moore examines market responses to U.S. common stocks sorted by earnings yield (inverse of P/E). He defines P/E as the ratio of stock price to the sum of the last available four quarters of net earnings excluding extraordinary items divided by current shares outstanding. For monthly tests, he assumes that earnings become available at the close of the last trading day of the reporting month. For daily and weekly tests, he assumes that earnings become available at the close of the first trading after earnings release date. He separately analyzes stocks with (published) positive and (generally unpublished) negative earnings yields. For comparison, he similarly calculates current monthly book-to-market ratios and sorts stocks by that alternative valuation metric. Using the specified accounting and price data for a broad sample of U.S. common stocks during 1973 through 2015, he finds that:
- A value factor portfolio constructed using earnings yield per the methodology of the Fama-French 3-factor model generate an average monthly gross premium nearly twice that of one constructed using current book-to-market ratio (0.71% versus 0.37%).
- A hedge portfolio that is long (short) the value-weighted tenth, or decile, of stocks with the highest (lowest) earnings yields, reformed monthly:
- Generates average gross next-month return 1.06%, with annualized gross Sharpe ratio 0.84, translating to 5-factor (market, size, book-to-market, profitability, investment) gross monthly alpha 0.75%.
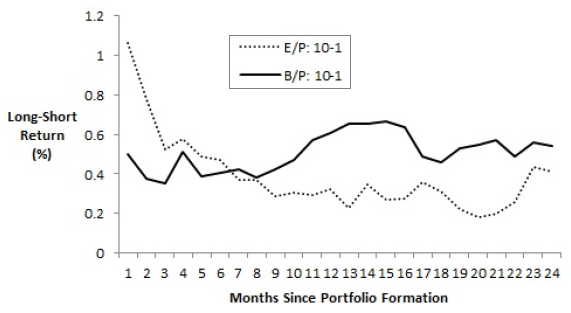
- On average strongly outperforms a comparable extreme decile hedge portfolio based on current book-to-market ratio sorts during the first two months after portfolio formation, but not thereafter (see the chart below). The initial disparity in returns between earnings yield and book-to-market hedge portfolios comes mostly from the long sides and supports belief that investors pay much more attention to P/E than to book-to-market ratio.
- Generates daily gross returns that on average mostly decrease during the week from 0.20% on Mondays to -0.02% on Fridays, with variation driven by the short side of the portfolio.
- Offers a market downside protection by generating average monthly gross return 2.61% (3.96%) during the 50% (25%) of months with the lowest market returns.
- Because financial data providers publish P/E ratios only for stocks with positive earnings:
- Earnings yield predicts returns only for stocks with positive P/Es.
- Stocks crossing from negative to positive P/E generate average gross cumulative abnormal returns (CAR) of 5% during the 60 days before, 2% during the 2-day window bracketing and 1.5% during the 60 days after. Stocks crossing from positive to negative P/E have converse negative CAR profiles. Institutional portfolio data suggests anticipation of changes in P/E sign.
- Stocks with high earnings yield tend to be relatively liquid, such that a strategy of buying illiquid stocks and selling liquid stocks is much more profitable for stocks with high than low earnings yields.
- Findings are robust to:
- Double sorts with past returns, share price or earnings momentum.
- 10 variations of earnings yield calculation.
- Two equal subperiods.
The following chart, taken from the paper, compares average gross returns for value-weighted extreme decile hedge portfolios based on earnings yield (E/P: 10-1) and current book-to-market ratio (B/P: 10-1), reformed monthly, by month over 24-month holding intervals across the full sample period. E/P: 10-1 and B/P: 10-1 portfolios should incorporate new information at the same rate, because earnings and book value per share both update quarterly for earnings announcements and monthly for prices. However, E/P: 10-1 generates strong returns the first two months that fade quickly thereafter, while B/P: 10-1 generates more even returns over the long holding interval. Patterns suggest that investors pay much more attention to P/E ratios than to B/P.

In summary, evidence indicates that investors may be able to exploit short-term (2-month) reactions to changes in stock earnings yields.
Cautions regarding findings include:
- Findings are gross, not net. Accounting for monthly portfolio reformation frictions and shorting costs would reduce reported returns and alphas. Shorting may not be feasible for some stocks due to lack of shares to borrow.
- Many investors cannot hold enough stocks to exploit findings reliably and would bear fees for delegating to a fund.